


There are many stock valuation methods available to investors, and it can be difficult to choose which metrics you should use, when you should use them and how to use them for valuing stocks.
This is further compounded by the fact that many metrics in fundamental analysis have varying degrees of utility depending on the sector of a stock. Not understanding which valuation metric to use can lead to a skewed picture of a stock’s intrinsic value.
This article will cover the most frequently used valuation models and how to apply them. Additionally, we’ll also look at the limitations of each valuation metric and when to use them in the stock market.
10 best stock valuation methods
- PE Ratio (Price to Earnings)
- FCF (Free Cash Flow) Yield
- FCF/Sales
- FCF/Short Term Debt
- ROCE (Return on Capital Employed)
- ROE (Return on Equity)
- ROA (Return on Assets)
- NAV (Net Asset Value)
- NTAV (Net Tangible Assets)
- EV/EBITDA (Enterprise Value/EBITDA)
1. P/E Ratio (Price to Earnings Ratio)
It would be wrong not to include P/E (also known as price-earnings) in this list as it is one of the most common metrics used by investors.
Let’s look at P/E Ratio and how to use it in detail…
What is P/E Ratio
The price to earnings ratio, also known as the P/E ratio, or PER, is the ratio of a company’s share price to the company’s earnings per share.
We can use the P/E ratio to value companies and to see the earnings multiple the market currently values the stock.
How to use P/E Ratio
Firstly, we need to know a stock’s earnings per share, which we looked at in more detail in my article on how to value a stock.
Once we know the earnings per share we can then calculate the P/E Ratio.
Calculating a company’s P/E is straightforward. We take the company’s price and divide it by the company’s earnings per share.
P/E ratio = share price / earnings per share
This then tells us what the market is paying for the company’s earnings. If a stock has a P/E ratio of 10, then we know the market is currently valuing the company’s stock at a price of 10x its earnings.
However, investing software, such as SharePad, will automatically calculate a stock’s P/E Ratio so you don’t need to manually calculate it.
P/E Ratio example
Let’s say we have a stock trading at 100p per share. It posts full-year earnings per share of 20p. What would be the P/E Ratio?
Remember, to calculate the stock’s P/E ratio we take the company’s share price and divide it by the company’s earnings per share…
In this example, it would be 100p / 20p and so the stock’s P/E Ratio would be 5.
This means that the market is paying 5x earnings for the stock. This does not mean much as the stock may have deteriorating earnings, in which case the stock may be a value trap, or it could mean the market is not ascribing much value to the stock.
Whether that sentiment and valuation is justified is another question.
P/E Ratio is a useful method of valuing the stock on its earnings multiple but to go deeper into our analysis we need to use other methods.
When to use P/E Ratio
P/E Ratio is best used to view the market sentiment for a stock.
For example, we see the share price of a stock and the first thing we want to know is the earnings multiple through P/E.
This tells us what the market is paying for the company’s earnings. From then, it’s our job to look further into the company to work out if that earnings multiple is fair.
Remember, P/E ratio is no good if the stock is valued ‘cheap’ but about to collapse due to the cumbersome debt it carries on its balance sheet.
PRO TIP: Use the PEG ratio (P/E ratio over earnings per share growth) in order to judge whether the market is overpaying or underpaying for the price-earnings multiple.
2. Free Cash Flow (FCF) Yield
Some investors prefer free cash flow as a measure of a return from a business rather than its earnings, as free cash flow is the cash left over expenses and expenditure to maintain the business’s assets has taken place. It is the cash left over, or ‘free’.
What is Free Cash Flow Yield?
The Free Cash Flow Yield is the percentage yield of free cash flow against the stock’s share price. It shows what percentage of the share price is free cash flow.
How to use Free Cash Flow Yield
Using Free Cash Flow Yield is simple:
Free Cash Flow Yield = Free Cash Flow / Market Capitalisation (market value)
We can calculate FCF by analysing the company’s cash flow statement…
FCF = Cash from operations – Capital expenditure
Again, SharePad is able to do this for us and shows any company’s Free Cash Flow Yield.
We can use FCF Yield as a metric of a company’s operational performance. The higher a company’s FCF yield then the more likely the company is able to satisfy its liabilities and obligations going forward.
Free cash flow can also be paid out to investors and shareholders in the form of dividends, so this metric may be of particular importance to income investors.
A company’s FCF Yield is a good indicator of financial stability.
Free Cash Flow Yield example
Here is a screenshot from a stock in SharePad that I’ve picked out called ‘Intercede Group’:
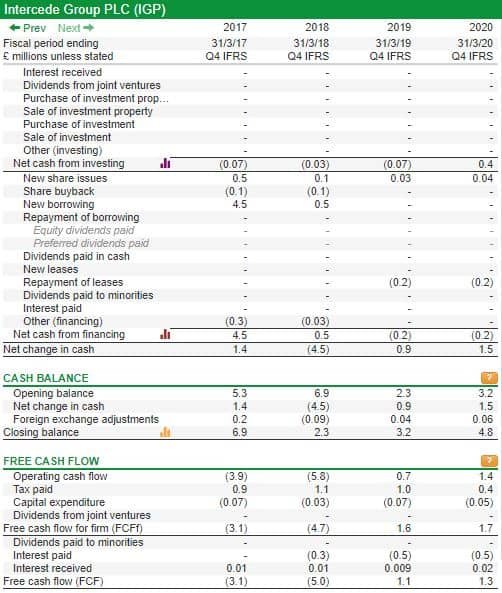
We can see that FCF in 2020 was £1.3m. At the date this screenshot was taken, the market capitalisation of Intercede Group is £45.2m.
Therefore, if we take the company’s FCF of £1.2m and divide this by the company’s market capitalisation of £45.2m we get 0.00265, or 2.65%.
I have shown an example of how to calculate this, but it’s much easier to have the FCF Yield as a column on the software as below:
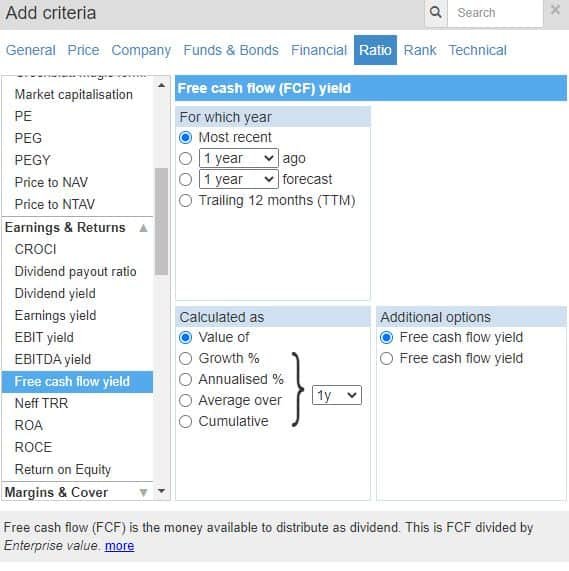
You can also filter for companies that have an FCF Yield over a certain percentage.
When to use Free Cash Flow Yield
We can use Free Cash Flow Yield when we want to see what yield the stock offers in terms of its free cash flow. Not all earnings are converted into cash, or into FCF.
FCF Yield looks at a valuation of the company only on what is left for the company once everything else has been paid.
3. FCF/sales
Free Cash Flow to Sales is another ratio that looks at the company’s FCF in comparison to its sales. It’s important for investors who want to see the quality of a company’s sales.
What is FCF/sales?
The FCF/sales metric identifies the percentage of a company’s sales that is converted into FCF.
How to use FCF/sales
FCF/sales can be tracked over varying periods to see if the company is improving its conversion rate of FCF into sales.
It can also be compared against peers in the same sector in order to see who is the best and most efficient at converting sales into FCF.
FCF/Sales Ratio = FCF / Revenue
The higher this ratio the better because it shows that the company is converting its sales into what matters.
FCF/sales example
Coming back to our example of Intercede Group above, we can look at the company’s revenue. This is also known as turnover. This is found from the income statement, and you can read a walkthrough guide on how to read the income statement here.
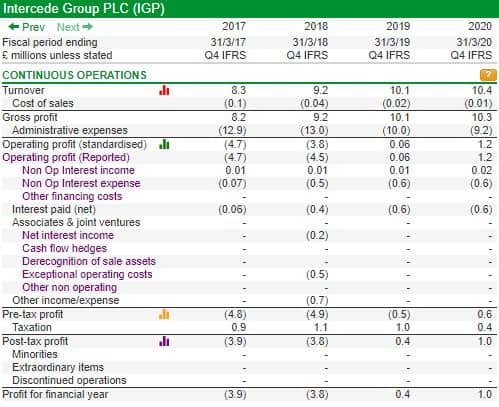
We can see that the company’s turnover was £10.4m in 2020. We already know the company’s FCF was £1.3m from looking at Intercede’s FCF Yield, and so we need to take the company’s FCF of £1.3m and divide this by its revenue of £10.4m.
This gives us a FCF/sales ratio of 12.5%. For everyone £1 in sales that Intercede generates, 12.5% of this will be converted into free cash flow.
When to use FCF/sales
FCF/Sales is best used when we want to see what percentage of the company’s sales are converted into free cash flow.
If company A generates £100m of revenue, and company B in the same sector generates only £50m, on this information alone company A may sound more attractive when looking at its sales.
But if company A has an FCF/sales ratio of 5% and company B converts 10% of its sales into FCF, then company A is generating £5m in FCF and company B is creating £10m in FCF!
We can filter for companies above a certain FCF/sales ratio to highlight quality companies on SharePad.
4. FCF/Short term debt
The next ratio concerns not the company’s quality of sales, but the free cash flow and the company’s debt.
FCF/Short term debt is a stability metric used by investors. It’s popular with those who are concerned about the financial health of a company.
What is FCF/Short term debt?
FCF/Short term debt is a financial ratio that shows the percentage of short term debt that would be repaid in a single financial year if all of the company’s FCF went towards repaying debt.
This shows the company’s ability to use cash that is left over for the firm after all expenses and expenditures have taken place to pay off the company’s debt.
How to use FCF/Short term debt
The higher the ratio of FCF/Short term debt, then the quicker the company can repay its debt and so can take on more debt sustainably than debt than companies that have lower ratios.
However, any increase in debt will, of course, result in a lower FCF/Short term debt ratio.
The formula for FCF/Short term debt is easy:
FCF/Short = Free cash flow / Short term debt
We take the company’s free cash flow and divide this by the company’s short term debt.
FCF/Short term debt example
Let’s assume our company has taken on £10m of debt in order to ramp up production of football stickers. We wanted to expand our factory and rather than diluting shareholders we decided to take out a loan.
Firstly, we need to calculate our FCF. We go to the cash flow statement and find out that our cash flow from operations after changes in working capital was £3m. However, we spent an additional £1.5m on upgrading and expanding our factory, and an addition £500k on servicing current machinery.
Therefore, our FCF is £1m (£3m in cash from operations minus capex of £2m).
To calculate our FCF/short term debt ratio we take our FCF of £1m and divide this by the company’s debt of £10m.
This gives us an FCF/Short term debt ratio of 0.1. If all things stay constant then it would take us ten years to pay off the company’s debt as 1 is equal to 1 year.
When to use FCF/Short term debt
You should use FCF/Short term debt when you want to know the company’s capability of paying off its short term debt. Knowing the debt alone does not give any idea of how much of a problem it can be.
You can also use FCF/sales with FCF/Short term debt in order to roughly calculate what will happen to the debt repayments if sales fall.
PRO TIP: You can use FCF/Debt which takes into account all debt too. This is a more conservative metric than FCF/Short term debt.
5. ROCE (Return On Capital Employed)
The next several metrics will look at returns ratios. These are useful in order to see what the company is getting in return on specific parts of the business.
The first return ratio we will look at is ROCE.
What is ROCE?
ROCE is Return On Capital Employed. This is a financial ratio that can be used to analyse a company’s allocation of capital efficiency.
To put this in simpler terms: this ratio will help you understand how good a company is at creating profits from its capital.
How to use ROCE
To use ROCE we use the below formula:
ROCE = Capital Employed / EBIT
A company’s Capital Employed is the business’s total assets minus its current liabilities.
EBIT is Earning Before Interest and Tax.
We can use ROCE to work out how much profit a company is generating on its capital employed. Rather than calculate this myself, I use SharePad.
Think of ROCE like a company’s interest rate. The higher the return, the more money the company can make by investing in itself.
Companies that are able to employ capital and generate lots more money in return are companies that can be highly profitable. Especially if the company in question is capital-light, that is, the company doesn’t need to spend huge amounts of money on maintenance capital expenditure.
If the company is able to pump that money invested in itself back into expansion, the company can see rapid growth rates.
Let’s look at an example of UK listed business Fevertree…
ROCE example
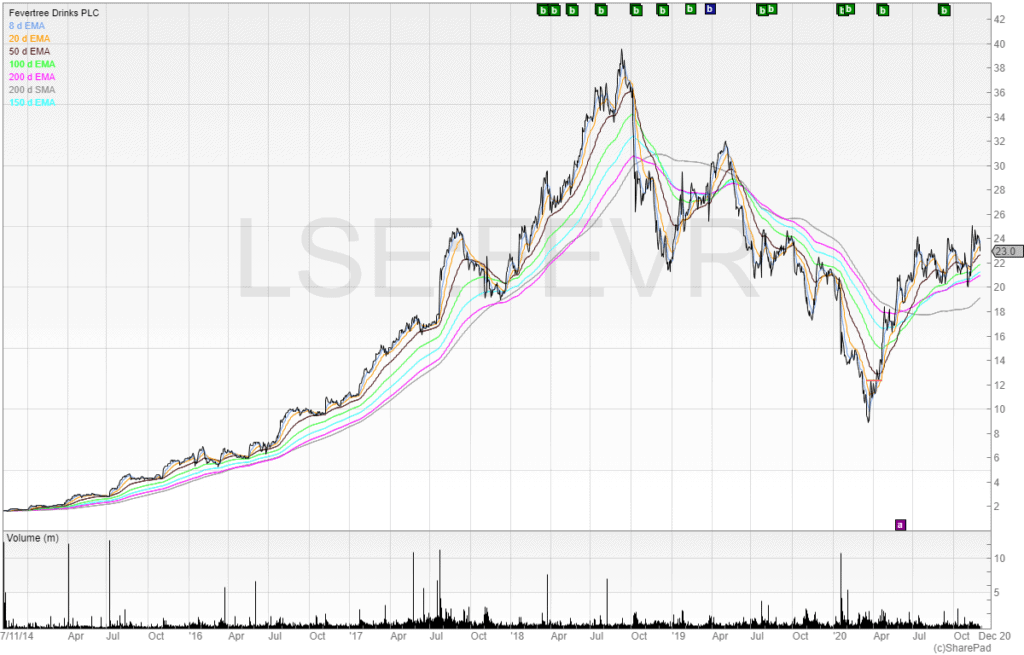
Fevertree (FEVR) listed on the London Stock Exchange in 2014 at 170p per share. Four years later, the stock was trading at over 4,000p per share – a gain of over 50x or 5,000%.
This stock was an unknown stock – it was a darling for several years. However, many investors shunned the stock in its early years (myself included) because it had a high PE ratio.
Below is the chart for Fevertree up to 2020:
And here are the ROCE percentages for Fevertree from 2016, in the penultimate row from the bottom:
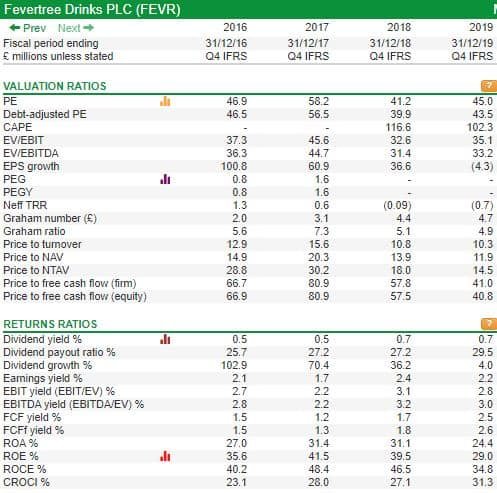
We can see that Fevertree was generating ROCE ratios of 40%+ up until 2019 when ROCE slipped to 34.8%.
Fevertree was also a capital-light business. It didn’t own a bottling plant, or do any of the manufacturing itself. Therefore, it didn’t need to spend hefty amounts on maintaining and expanding machinery. All it needed to do was market the product, and feed the profits from this back into the business.
The fact that Fevertree’s ROCE ratios were so high, and that it was able to reinvest so much of that money right back into the business for growth, can explain the stock’s stratospheric rise in the first several years of its listed history.
When to use ROCE
ROCE is effective when comparing similar companies in the sectors and industries where companies deploy a lot of capital maintenance. This is because the return on this capital employed is more significant the higher the capital employed.
These sectors include resources companies that use a lot of machinery and equipment such as oil, gas and mining companies, as well as hospitality which requires regular capex on new units and refurbishing fatigued units.
ROCE is also particularly useful for finding multi-bagger stocks. As seen above in the example, by finding companies that generate high returns on the capital it spends on itself this can alert us to the stock market winners of tomorrow.

6. ROE (Return on Equity)
The second returns ratio we will cover in this article is ROE (Return On Equity).
What is ROE?
Return On Equity (ROE) is a financial performance measure which is calculated by taking the company’s net income and dividing this by shareholders’ equity.
Shareholders’ equity is the company’s assets minus its liabilities (as we learned in the guide on how to understand a balance sheet).
Therefore, ROE is considered to be the company’s return on its net assets.
How to use ROE
The calculation for ROE is simple:
Return On Equity = Net income / Shareholders’ equity
This ratio is shown as a percentage and can be calculated for all companies that have both net income and shareholder equity as positive numbers.
Return On Equity can be used to compare with other comparable companies in the sector. It is relatively meaningless when comparing one company to another in a completely different sector.
This is because companies that are asset and debt heavy (for example, some retailers and resource production companies have plenty of assets financed by debt), may have a lower return on equity compared to a tech company which has a higher level of net income compared to the assets and liabilities on the balance sheet.
Comparing Royal Dutch Shell (RDSB) to Fevertree would not be a fair comparison here and so we must be careful when deploying ROE comparisons.
Potential pitfalls of ROE
If a company’s ROE stands out compared to its competitors and peers then there may be a reason.
Firstly, it could be because the company’s net income performance has been strong and therefore this pushes up the ROE percentage.
However, it could also be a warning sign for several reasons:
- High debt on the balance sheet
- Retained losses on the balance sheet
- Lack of profitability
High debt on the balance sheet
The first reason that ROE can be exceptionally high is due to a large amount of debt on the balance sheet. As shareholder equity is equal to the assets minus the liabilities on the balance sheet, then the more debt the company has the lower the shareholder equity can fall.
When shareholder equity is much reduced then when net income is divided by shareholder equity it can produce a larger ROE than if the debt was lower or non-existent.
Companies finance themselves with debt for many reasons, and a common trick is to buy back the company’s own shares. This increases the company’s earnings per share (EPS) artificially as the debt does not have any income on the company’s revenue or net income.
Retained losses on the balance sheet
If there are retained losses on the balance sheet then this can reduce shareholder equity. As we saw above, reduced shareholder equity can lead to an artificially inflated ROE.
Lack of profitability
The final reason why ROE can be unnaturally high is because of a lack of profitability. This is because when there is a negative net income and also negative shareholders’ equity this can give a positive and high ROE.
ROE should only be calculated when both net income and shareholder equity are positive.
ROE example
Let’s imagine we own a company. It is going to make £2,000,000 in post-tax profit, or net income, for the financial year.
We also know that shareholders’ equity for the same year (we must use data from the same financial periods) is going to be £12,000,000.
Remember, ROE is net income / shareholder equity. So we take £2,000,000 and divide this by £12,000,000.
This gives us 0.1667 on our calculator, or 16.67%. Therefore, we know that the ROE for our company is 16.67%.
7. ROA (Return On Assets)
The third and final returns ratio we will cover in this article is ROA.
What is ROA?
ROA is Return On Assets. It is a financial performance measure that is calculated by taking the company’s assets and dividing this by shareholders’ equity.
Return On Assets is a less conservative measure of financial performance than ROE and concerns the return a company generates solely from its assets.
What is the difference between ROA and ROE?
ROA and ROE are similar because both ratios look at how the company puts its resources to work.
However, ROE measures the return on a company’s equity. The more leverage and debt that a company has, the higher the ROE will be compared to the company’s ROA.
This is because ROA accounts for a company’s debt within the calculation.
How to use ROA
The calculation for ROE is simple. We simply take net income and divide this by total assets.
Return On Assets = Net income / Total assets
This ratio shows the company’s efficiency in generating returns from its total assets.
ROA example
We can use SharePad to tell us the ROA of a company, or we can do it manually by using data from the income statement and the balance sheet.
Let’s look at the bottom of the income statement from Boohoo’s (BOO) Final Results in 2020:
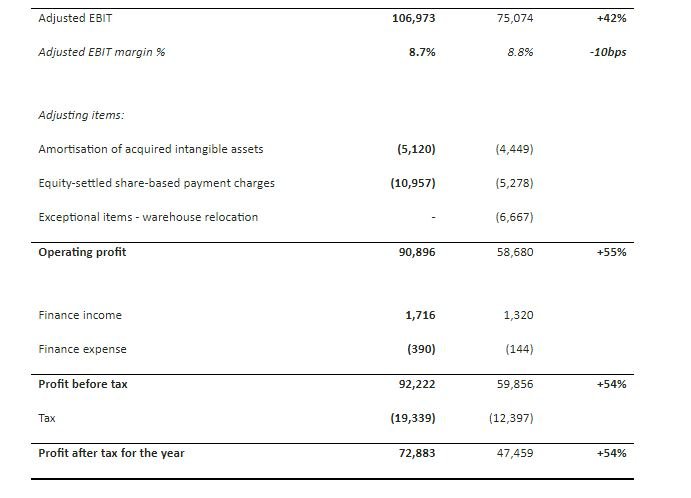
We can see from the bottom line that profit after tax for the year (or net income) was £72,883,000 (the figures are given in 000 as stated at the top of the income statement which isn’t shown here).
Moving to the balance sheet which we can see below, total assets are £569,491,000:
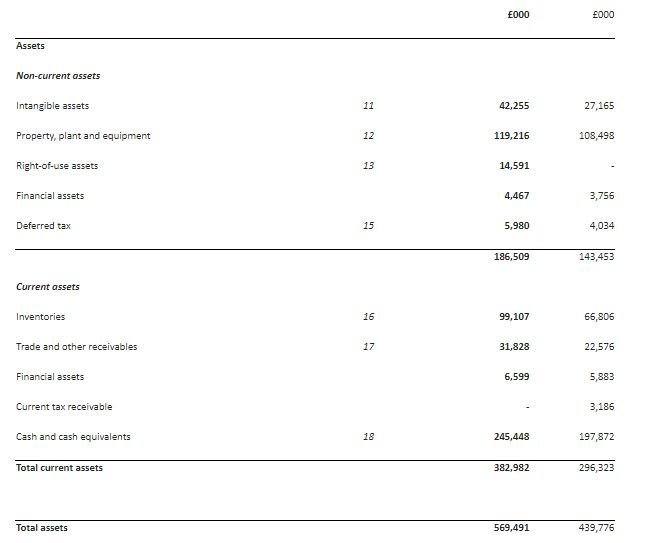
Therefore, we need to take the net income of £72,883,000 and divide this by Boohoo’s total assets of £569,491,000.
This gives us a ROA of 0.128 or 12.8%.
8. NAV (Net Asset Value)
NAV is the first of two valuations we’ll look at that measure the value of a company. First, let’s look at NAV and then we’ll move onto NTAV.
What is NAV?
NAV is Net Asset Value. It is a measure that calculates the book value of a company and provides a value of what the company would be worth if it were to stop trading that day and all the assets were sold off at their respective values.
How to use NAV
NAV is used to compare the company’s current stock price and the net asset value price in order to identify stocks are potentially undervalued.
NAV, or ‘book value’ as it is commonly known, was a favourite of the father of value investing Benjamin Graham. He was a Professor of Warren Buffett and this valuation metric was also used by Berkshire Hathaway.
To calculate NAV, we need to take the assets and minus the liabilities. We then divide this number the amount of shares in issue.
Net Asset Value = (Assets – Liabilities) / Total outstanding shares
By dividing this figure by the total outstanding shares we will get a NAV per share.
NAV example
Let’s imagine we have a company. We have 10,000,000 shares in issue. Our company has assets on the balance sheet of £60,000,000 and liabilities of £20,000,000.
To calculate the NAV per share, we first need to take the assets of £60,000,000 and minus the liabilities of £20,000,000. This gives us a total of £40,000,000.
We then need to divide this number by the amount of shares in issue of 10,000,000.
This gives us a total of 4, or a NAV per share of 400p.
We can then use this with reference to the current stock market price. If our equity is trading in the market at a price of 500p then we could argue that the stock is overvalued on a NAV per share basis because it is traded at a premium to its book value.
If the share price was 300p we would say our company was trading at a discount to its NAV per share.
What are the limitations of NAV?
One of the pitfalls of NAV is that it includes all assets – both tangible and intangible. This is a problem because intangible assets are valued at the discretion of management.
If The Coca-Cola Company say the value of its Coca-Cola brand is only worth £1m then you might argue that it is undervalued. And if Sam from locally-owned Sam’s Cafe says his brand is worth £2m despite only averaging 20 customers a week, you might disagree.
This is why we must be careful when using NAV.
For example, Argos Resources (ARG) has a NAV of £29.7m compared to its market cap of £4.7m.
Looking at NAV alone, this company would be undervalued. However, let’s look at the balance sheet closer:
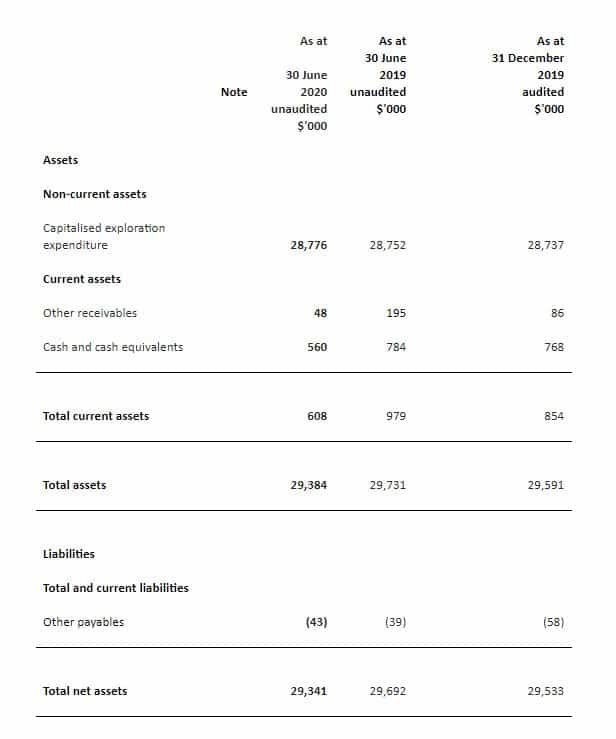
Argos Resources’ management seems to believe that the £28,776,000 they have spent on drilling holes is an asset.
This is bizarre because not a shred of value from this drilling has been delivered. But they believe this money that has been wasted offers value for shareholders.
This is why it is so important to never rely on a single valuation metric and always look closely at the balance sheet and financial statements.
In the next ratio, we’ll learn how to mitigate this problem…
9. NTAV (Net Tangible Asset Value)
NTAV is the second and final book value metric we’ll look at in this article.
What is NTAV?
NTAV is Net Tangible Asset Value. It is very similar to NAV only it removes intangible assets. This means it is a more conservative valuation metric and only focuses on what is real.
For example, property, equipment, and inventory, are all examples of tangible assets. Brands, goodwill, and capitalised costs are intangible assets.
How to use NTAV
We use NTAV in a similar way to NAV.
To calculate NTAV, we need to take the tangible assets and minis the liabilities (whereas in NAV it is the total assets). Once we have this number we then divide this by the number of shares in issue.
Net Tangible Asset Value = (Tangible assets – Liabilities) / Total outstanding shares
The result of this calculation gives us the NTAV per share.
NTAV example
Let’s come back to the company we used in the NAV example. It still has 10,000,000 shares in issue. Our company still has assets on the balance sheet of £60,000,000 and liabilities of £20,000,000.
However, £20,000,000 of these assets are made up of intangible assets. Goodwill accounts for £10,000,000, and our brand is valued at £10,000,000 too.
Therefore, our company has tangible assets of £40,000,000 out of the total assets of £60,000,000.
To calculate the NTAV per share, we first need to take the tangible assets of £40,000,000 and minus the liabilities of £20,000,000. This gives us a total of £20,000,000.
We then need to divide this number by the amount of shares in issue of 10,000,000.
This gives us a total of 2, or a NAV per share of 200p.
We can again then use this with reference to the current stock market price. If our equity is trading in the market at a price of 300p then we could argue that the stock is undervalued on a NTAV per share basis because it is traded at a discount to its tangible book value.
And if the share price was 100p we would say our company was trading at a premium to its NTAV per share.
Using NTAV gives an investor a ‘margin of safety’. Benjamin Graham that if he bought companies that had a book value higher than the value of the equity that was trading in the market then he had downside protection.
This was because he believed that if the company was to stop trading tomorrow, the assets that were sold off would be worth more than what he had paid for the shares.
10. EV/EBITDA
This final stock valuation method in this article is EV / EBITDA.
What is EV/EBITDA
EV/EBITDA is two metrics used together. EV is Enterprise Value.
The Enterprise Value (EV) of a company is calculated by taking the market capitalisation of the company, adding the sum of its total debt, and subtracting its total cash.
Enterprise value = market capitalisation + total debt – net total cash
This is the first part of the metric.
The second part of the metric is EBITDA. This is Earnings Before Interest, Taxes, Depreciation, and Amortisation. This is the company’s cash earnings before non-cash expenses.
It is not the same as operating profit or gross profit (a common mistake). This is because operating profit takes into account depreciation and amortisation and gross profit does not take into account operating costs.
The EV / EBITDA ratio, then, compares the company’s value that includes the debt to the company’s cash earnings minus its non-cash expenses. Investors should use this ratio when they are looking to assess the company’s total monetary value.
How to use EV/EBITDA
This ratio is commonly regarded as the best metric to use when comparing companies within the same industry.
It is calculated by taking the companies EV and dividing this by its EBITDA. We already know that to calculate the EV we need to take the company’s market capitalisation, minus its cash, and add its debt.
To calculate the company’s EBITDA we can go to a company’s operating profit and then add back the depreciation and amortisation. We can find the company’s operating profit on the income statement and the depreciation and amortisation on the balance sheet.
EV/EBITDA = EV / EBITDA
In general, for EV/EBITDA the lower this number the better. This is because it shows a lower multiple of the company’s cash earnings against its cash value.
EV/EBITDA example
To find out a company’s EV / EBITDA ratio, we can use SharePad in order to get this number quickly.
However, let’s use the example of our company again. Our company has a market capitalisation of £20m, and it has £5m in cash on the balance sheet as well as £10m in debt.
To get our EV, we need to take our market capitalisation, minus our cash, and plus our debt.
That gives us an EV of £25m (£20m market capitalisation – £5m cash + £10m debt).
To calculate our EBITDA, we go to the income statement and get our operating profit. We can see that operating profit was £40m, our taxes on the profit was £5m, we depreciated our tangible assets by £4m, and amortised our intangible assets by £1m.
Therefore, our EBITDA is £50m (£40m operating profit + £5m tax + £4m depreciation + £1m amortisation).
Once we have our EV and EBITDA the ratio is simple. Divide EV by EBITDA.
£25m EV / £50m EBITDA gives us an EV/EBITDA multiple of 2.
This is an attractive valuation metric because it includes debt as a factor in the valuation, and also strips out all non-cash costs. But it should not be relied upon as depreciation and amortisation are real costs to a business despite not being cash.
As Warren Buffett famously once said:
“Who do management think pays depreciation and amortisation? The Tooth Fairy?”
Conclusion
NOTE: I have deliberately left out discounted cash flow as it can be complex and it’s not one I use myself. This model takes the future cash flows of a company and discounts them using a discount rate to bring the present value of the stock compared to its current price.
When analysing the value of the company we cannot rely on a single metric for a complete valuation.
Single metrics are useful when conducting relative valuations or when discounting same sector companies (for example, with dividend discount model (DDM)), but we must use a variety of metrics such as the ones above.
Using several of the ten valuation methods above we account for a stock’s debt, the company’s earnings and quality of earnings, as well as its returns.
Cash flow models such as DCF models are an advanced method using the stock’s future earnings to come up with an intrinsic value of a stock. However, this rate of return cannot be relied upon as a valuation technique because the further we discount from the future the more that can go wrong!
If all growth models and future dividends could be discounted accurately to the present value of the stock then there would be a lack of volatility in the stock market. The value of a company can fluctuate and so this is why I believe these ten metrics are the most useful.