

Understanding the market cycle isn’t easy, even for experienced stock buyers and traders who work in the market every day.
Cycles vary in length depending on your goals with each phase presenting a unique challenge designed to test your nerve.
Emotions play havoc with our minds too, leading us to make gut decisions or follow the herd instead of holding firm.
In this guide I’ll:
- Define the market cycle and how it works
- Discuss its phases – so you can spot trends
- Identify ways to tell which cycle we’re in
By the end, you’ll have a deeper understanding of the economic and human behaviours that drive market cycles which will help you to make confident investment decisions.
What is the stock market cycle?
The market cycle is an economic pattern that occurs in a specific market or business environment. These cycles respond to changes in economic conditions, regulations, or technological innovation and vary in length depending on the market and time horizon. Stock market cycles follow four phases: accumulation, mark-up, distribution, and mark-down.
Stocks usually to conform to specific patterns – making it easier for us to spot and predict trends to guide our decision making.
But market cycles aren’t easy to predict. They can last months or years and don’t always have a convenient start or endpoint.
There’s also the issue of timelines. An options day trader working in five-minute bars might witness several cycles in an hour. But for an oil trader a cycle could last decades.
A better question to ask is ‘what does my particular market cycle look like?’ This will help you look for – and respond to – trends that indicatewhen to buy or sell your shares.
What we can say for certain is that:
- Market cycles are responses to business environments
- Time frames vary depending on individual aims
- Securities respond differently at each phase
- The same four phases repeat across time
Now we know the basics of market cycles, let’s look closer at what drives them.
How market cycles work
When interest rates are low, this decreases the cost of capital and encourages investment. This is because capital is cheap and the returns are higher. This spending boosts the economy and when the economy increases, more and more transactions occur (we spend more). This confidence is infectious. More businesses open, profits boom, and investments typically yield stronger returns.
However, all things come to an end. When interest rates start to rise, this has implications for everyone across the economy. Suddenly, the cost of borrowing becomes more expensive, and so investment projects no longer hold the same attraction. Bonds and debt see cash inflows and money typically rotates out of equities. There can also be a distinct lack of confidence in the economy. At this point, stocks fall, and sellers start protecting their profits.
However, the stock market does not equal the economy. Stocks can have their own cycles regardless of the market sentiment.
Tell-tale signs to look out for might include:
- Falling interest rates that indicate a buoyant and bearish market that’ll pay back our investment severalfold
- Rising inflation that suggests an imminent rise in interest rates, forewarning market contraction and sluggish economic growth
These short-term highs and lows in response to rates predictions reflect whether the market is bullish (prices are rising due to demand) or bearish (prices are falling) with these ‘moods’ corresponding to the market cycle’s phases.
But these quick moves cannot tell us which phase we are in. They are expressions of market sentiment only.
Basing our strategy on fluctuations in buying behaviour alone is dangerous. Understanding the average length of a market cycle can help us understand why.
What is the average market cycle?
Market cycles vary in length depending on (a) who you are; and (b) what you’re trying to achieve. This means the term ‘average’ is hard to pin down. Length also varies depending on whether we’re discussing bull or bear markets.
The average length of a bull market is 50 months. A bear market lasts around 21 months. Because the sentiment varies in each case, we must adapt our asset allocation strategy to get the best returns.
By this token we might choose to:
- snap up bargain stocks at a lower price during a bear market as panic sets in – then sell for a profit when the market rises.
- presuming the bull market shows momentum, buy high in the hope stock value will reach new peaks before selling (my preferred strategy).
But to get the best returns we need to understand the entire cycle. That way we’ll be able to take a holistic view. This way we see the bigger picture and we’re able to create profitable long-term strategies instead of reacting in the moment.

What is the full market cycle?
A full market cycle comprises both a bullish and bearish period.
Bull markets create paper millionaires. But often many give some (or all) of their hard-earned money back during the following bear market. Overall, they make a loss, and this is something we need to avoid.
Looking at the whole cycle – and not just parts of it – is essential if you want to get the best possible prices to buy and sell.
And to get the best possible prices you need to understand what you’re risking before taking your position.
Understanding the four market cycle phases will help you spot trends and make more strategically successful decisions.
The four phases of a market cycle
Each cycle has four phases, each with its own driving factor. Understanding these stages, their trends, and behaviours, is vital if we want to succeed in the financial markets.
1. Accumulation phase
The accumulation phase, also known as stage 1, is where we see a flat base being formed on the chart after the stock has bottomed out. Confidence rises as investors and savvy traders become bullish and confident the worst has happened. Stock prices will creep along as experienced veterans and early adopters buy slowly to avoid showing their hand.
Here’s an example of a stage 1 stock, Audioboom.
Notice how the stock trended sideways in a trading range for several years with no clear direction.
Then, in October 2021 we see the volume start to ramp up and the stock breaks out of the high at 280p.
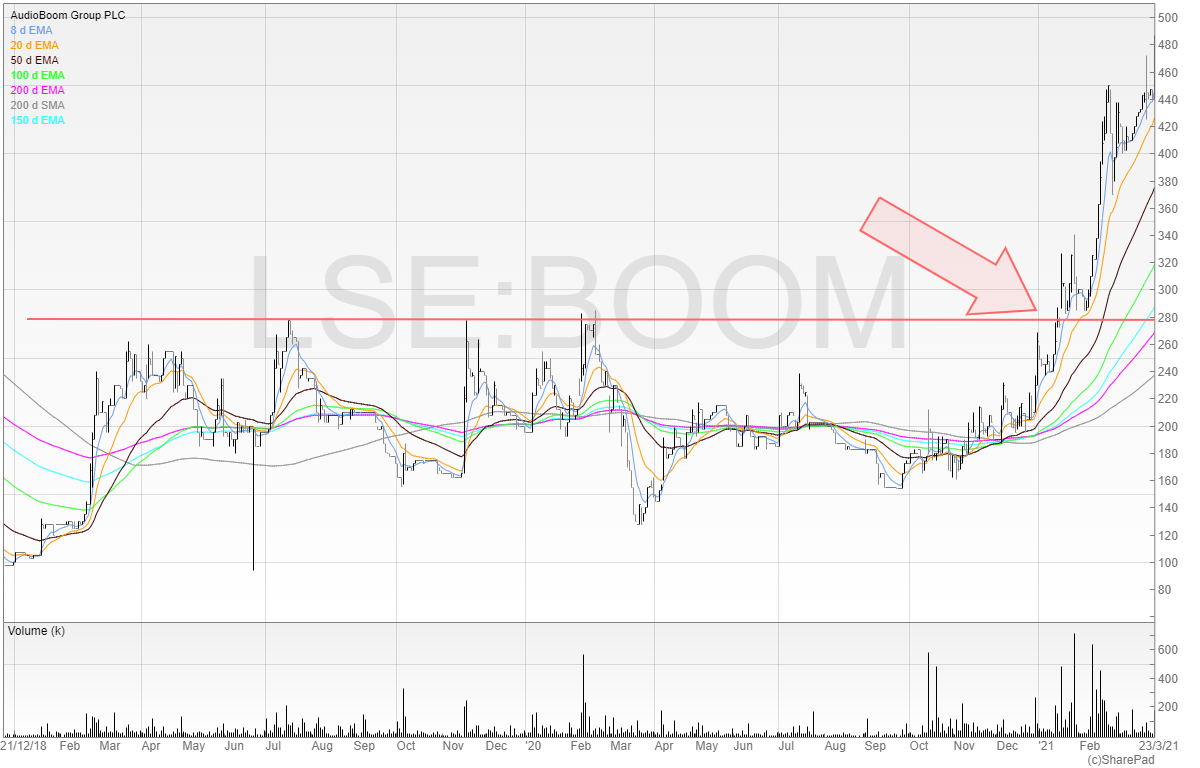
I alerted my followers to this move here:
Stage 1 stocks can trend sideways for weeks, months, and even years.
2. Advancing phase/Markup phase
The advancing phase (also known as the mark-up phase) is stage 2. In this stage buyers of the stock are now overpowering sellers and an upward trend is developing that can be identified by higher highs and lower lows. Smart investors and innovators recognise this shift in sentiment and start buying more stock.
Stage 2 stocks will often have a good story, either by a change in business models/significant earnings prospects, and it can also be due to new products brought into the market.
Here is an example of a stage 2 stock, again in Audioboom.
Stage 2 stocks are present a buying opportunity on dips (hence the phrase “buy the dip”).
Toward the end of this phase, the fear of missing out takes over and a mad rush ensues that sees last-minute investors panic buying. This is euphoria and often a good time to sell – however like everything this is easier said than done!
Equally, the market can peak at this stage and turn rapidly from bullish to bearish.
“The first stage, when only a few unusually perceptive people believe things will get better, the second stage, when most investors realize that improvement is actually taking place, and the third stage, when everyone concludes things will get better forever.”
Howard Marks, Mastering the Market Cycle: Getting the Odds on Your side
3. Distribution phase
The distribution phase, also known as stage 3, is where sellers now dominate the market. Bullish sentiment is conceding to doubt as prices stablise – for weeks and sometimes months. False starts may also lead us to believe the market is settling.
Long-term investors won’t be worried. But traders may become anxious as they try to offload stock to latecomers looking to make a profit before the market freefalls during the mark-down stage.
If you’re still holding your position during the final phase of the market cycle, you could find yourself in an unprofitable position.
Although this phase usually trends off gradually, geopolitical events (like pandemics) can accelerate matters unexpectedly.
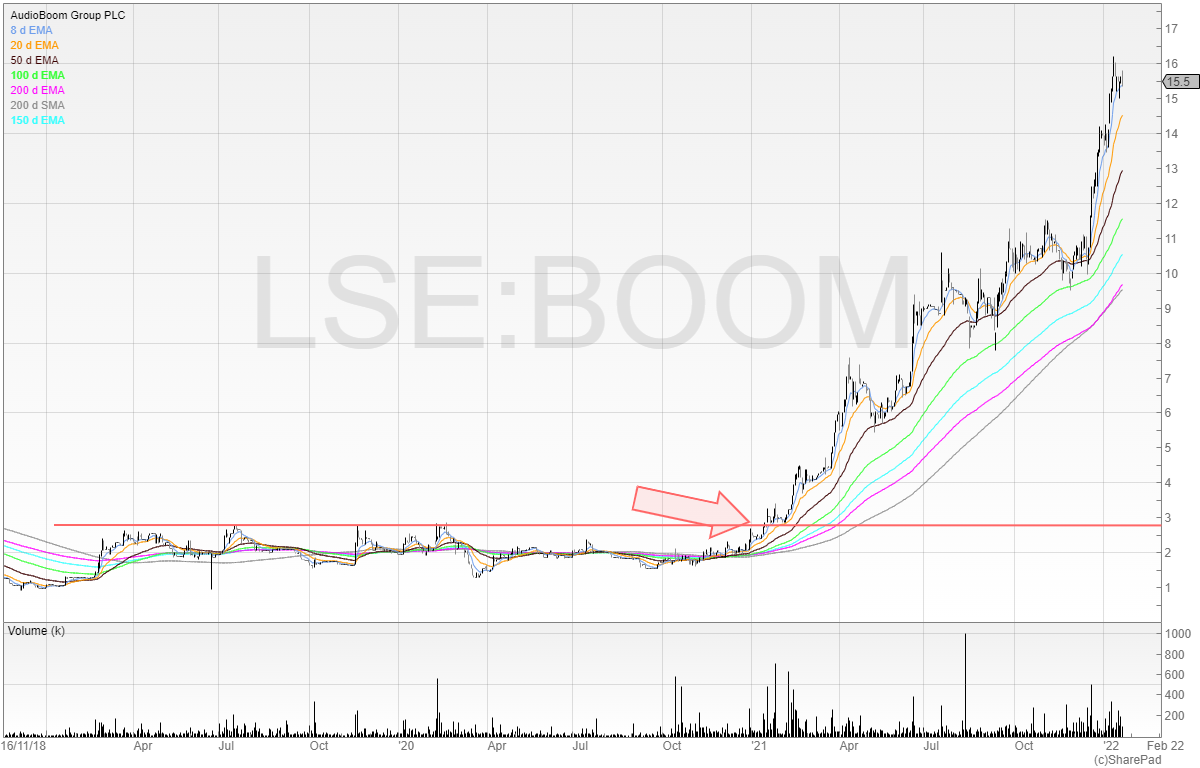
Here is an example of a stage 3 stock, Burford Capital.
Typical price action here is when the stock trades sideways after an extended run and the buyers can’t overpower the supply that’s now coming into the market. Institutions and the so-called ‘smart money’ will likely be unwinding positions here.
A clue of a stage 3 stock can be the stock falling on volume on good news. I’ve marked two arrows in the chart above where Burford Capital announced excellent results only to sell off on high volume on the day. This was a clear warning sign that institutional money was taking advantage of the liquidity to get out.
I warned investors of Burford Capital that this was a stock I wanted to short if it broke through the support zone on the Investors’ Chronicle podcast.
Within a week, the stock was down nearly 80%. I had no idea that Muddy Waters Research would declare a short position in the stock but the clues were there.
4. Capitulation phase/Markdown phase
The capitulation phase (also known as the mark-down phase) is the final stage 4. This is when sellers overwhelm buyers and the price begins to slide. If you hold your position during the capitulation stage stage, you’ll find your investment is worth less than you paid. You could wait for a miracle – or cut your losses before the market plunges to a new low.
If you sold when the warning signs appered, congratulations. You saw the market was topping out and can now start to short depreciating stock that can be rebought for a profit or you can wait until the stock bottoms out and begins a new stage 2.
Here is an example of a stage 4 stock, Games Workshop.
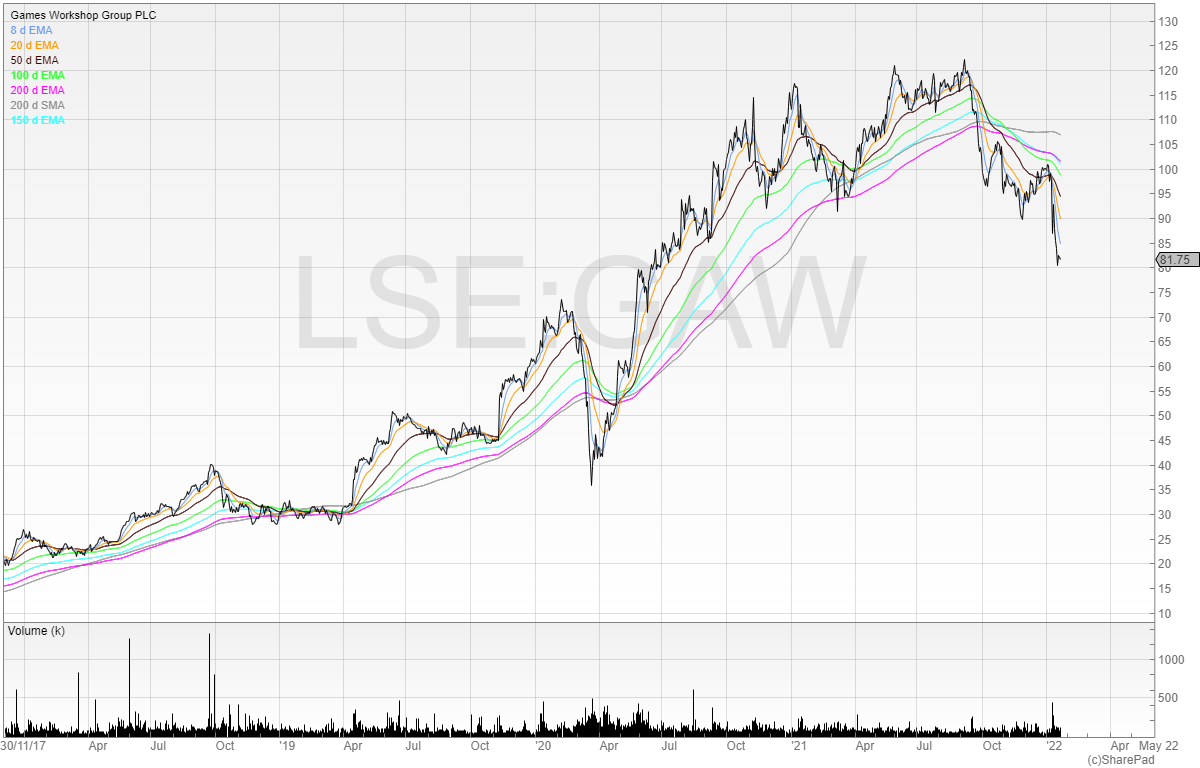
We can see how the stock has rolled over in stage 3 and is now beginning a stage 4 downtrend in the capitulation stage.
How to determine the current market cycle
As we discovered earlier, market cycles don’t have clear beginnings, middles, and ends. And even then, the lifespan of a cycle depends on your perspective and overall goals.
What we can say is that:
- Changes in the market drive cycles – meaning we should watch developments in industries of interest to us – so we can spot trends or changes early.
- Interest rates, unemployment rates, and security prices (if correctly assessed) serve as useful indicators that tell us the market is in a state of flux.
- Valuations tend to be cheaper in the early stages, giving us the latitude to take risks; toward the cycle’s end the opposite occurs with valuations becoming significantly eye-watering.
- Cycles can be spotted in retrospect, helping us to gauge which phase is next and allowing us to adapt our strategy accordingly.
This gives us a toolkit we can use to gauge where we are in the cycle before buying or trading. It also stops us being too reactive.
What we need is a long-term trading plan that aligns with our goals and specific timeline – whether the market is at the top, down, or bottom phase.