Welcome to this comprehensive guide on understanding the yield curve. As a finance expert, I will walk you through the basics, types, factors influencing its shape, and the yield curve’s practical applications. By the end of this article, you will have a solid foundation for navigating the intricate world of the yield curve. So let’s dive in!
The Basics of the Yield Curve
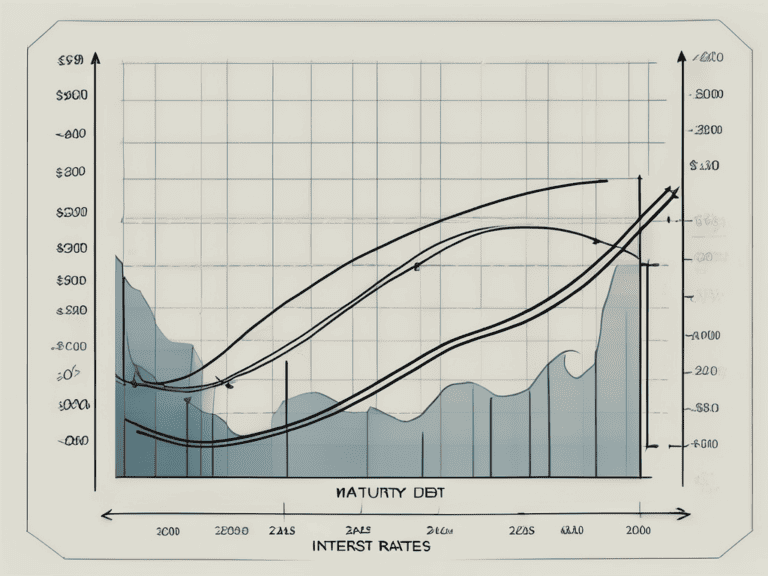
The yield curve is a crucial concept in the field of finance. It represents the relationship between the interest rate (or yield) and the maturity of debt securities issued by the government, such as Treasury bonds or notes. The yield curve is often plotted on a graph, with maturity on the x-axis and the yield on the y-axis.
Definition and Importance of the Yield Curve
The yield curve is a graphical representation of the borrowing costs for the government across various maturity periods. It provides key insights into the market’s expectations for future interest rates and economic conditions. Understanding the yield curve is essential for investors, policymakers, and economists alike as it helps gauge the overall health of the economy and make informed investment decisions.
When analyzing the yield curve, it is important to consider the shape it takes. The curve can be upward sloping, flat, or inverted. An upward sloping yield curve indicates that long-term interest rates are higher than short-term rates, reflecting expectations of economic growth. A flat yield curve suggests that short-term and long-term rates are similar, indicating uncertainty about future economic conditions. An inverted yield curve occurs when short-term rates are higher than long-term rates, often signaling an impending economic downturn.
Moreover, the yield curve can provide insights into inflation expectations. If the yield curve is steep, with higher long-term rates, it may suggest that investors anticipate higher inflation in the future. Conversely, a flat or inverted yield curve may indicate lower inflation expectations.
Components of the Yield Curve
The yield curve consists of three main components: the short-term, medium-term, and long-term. The short-term yields are typically influenced by the current monetary policy and market expectations. Central banks, such as the Federal Reserve in the United States, play a significant role in determining short-term interest rates through their monetary policy decisions.
Medium-term yields fluctuate due to economic factors and inflation expectations. These yields are influenced by factors such as GDP growth, unemployment rates, and consumer price index (CPI) data. Investors closely monitor these economic indicators to assess the medium-term outlook for interest rates and adjust their investment strategies accordingly.
Long-term yields are influenced by structural factors and market sentiment about long-term economic prospects. Structural factors include demographic trends, technological advancements, and fiscal policies. Market sentiment, on the other hand, refers to investors’ overall perception of the economy’s future direction. Positive sentiment can drive long-term yields higher, while negative sentiment can push them lower.
It is important to note that the yield curve is not static and can change over time. Economic events, policy decisions, and market sentiment can all impact the shape and movement of the yield curve. Therefore, investors and analysts continuously monitor the yield curve to stay informed about potential shifts in interest rates and economic conditions.
Types of Yield Curves
Now that we have a fundamental understanding of the yield curve, let’s delve into its various types.
Normal Yield Curve
A normal yield curve, also known as an upward-sloping yield curve, occurs when long-term interest rates are higher than short-term rates. This type of curve reflects a healthy economy, with investors demanding higher compensation for the longer-term risk and inflation uncertainty.
When the economy is thriving, businesses and individuals are more optimistic about the future. This optimism leads to increased borrowing and investment, which drives up demand for long-term loans. As a result, the interest rates on these loans rise, creating an upward slope on the yield curve.
Moreover, a normal yield curve indicates that investors have confidence in the economy’s growth prospects. They believe that the risk of inflation is higher in the long term, and therefore, they require higher interest rates to compensate for this risk. This expectation of future economic growth and inflation is reflected in the upward slope of the yield curve.
Inverted Yield Curve
An inverted yield curve, on the other hand, happens when short-term interest rates exceed long-term rates. This curve is often seen as a warning sign of an impending economic downturn or recession. It suggests that investors expect interest rates to decrease in the future due to an economic slowdown.
During periods of economic uncertainty or pessimism, investors become more risk-averse. They anticipate a potential decrease in economic activity and inflation, leading them to seek the safety of short-term investments. This increased demand for short-term bonds drives down their yields, causing short-term interest rates to exceed long-term rates.
An inverted yield curve is closely monitored by economists and investors as it has historically preceded economic recessions. It indicates that market participants anticipate a future decline in interest rates, reflecting their concerns about the economy’s health.
Flat or Humped Yield Curve
A flat or humped yield curve implies that short, medium, and long-term interest rates are relatively equal. This situation is usually observed during transitional periods in the economy, where market participants are uncertain about future economic conditions.
When the yield curve is flat or humped, it suggests that investors have mixed expectations about the economy’s direction. Some investors may be optimistic about future growth, leading to demand for long-term bonds and higher long-term interest rates. At the same time, other investors may be more cautious, preferring short-term investments and driving down short-term interest rates.
This type of yield curve often occurs during times of economic transition, such as when the economy is moving from a period of expansion to a period of contraction, or vice versa. It reflects the uncertainty and differing opinions among investors regarding the future economic conditions and interest rate movements.
Factors Influencing the Shape of the Yield Curve
The shape of the yield curve is influenced by various factors. Let’s explore two main drivers:
Interest Rates and the Yield Curve
The Federal Reserve’s monetary policy decisions significantly impact short-term interest rates, which subsequently affect the shape of the yield curve. When the central bank raises rates to combat inflation, short-term rates increase, potentially leading to a flatter or inverted yield curve.
For example, during periods of economic expansion, the Federal Reserve may choose to increase interest rates to prevent excessive borrowing and spending, which can lead to inflation. This increase in short-term rates can result in a flattening of the yield curve, as borrowing costs become more expensive for businesses and consumers.
Conversely, when the Federal Reserve lowers interest rates to stimulate economic growth during a recession, short-term rates decrease. This can lead to a steeper yield curve, as borrowing becomes more affordable and encourages businesses and consumers to invest and spend.
Economic Outlook and the Yield Curve
The overall economic outlook plays a crucial role in shaping the yield curve. Positive economic indicators often result in upward-sloping yield curves, reflecting investor confidence in future economic growth.
When economic indicators, such as GDP growth, employment rates, and consumer spending, are strong, investors anticipate higher future interest rates and inflation. As a result, they demand higher yields on longer-term bonds to compensate for the potential erosion of purchasing power caused by inflation. This increased demand for longer-term bonds pushes their prices up and yields down, leading to an upward-sloping yield curve.
On the other hand, negative economic indicators can flatten or invert the yield curve. When investors have a pessimistic outlook on the economy, they may anticipate lower future interest rates and inflation. This leads to a higher demand for longer-term bonds, pushing their prices up and yields down. Consequently, the yield curve may flatten or even invert, with shorter-term bonds yielding higher returns than longer-term bonds.
It is important to note that the shape of the yield curve is not solely determined by interest rates and the economic outlook. Other factors, such as market expectations, investor sentiment, and global economic conditions, also contribute to its shape. Therefore, analyzing the yield curve requires a comprehensive understanding of various factors and their interplay.
Yield Curve as a Predictor of Economic Activity
The yield curve’s predictive power for economic activity is widely recognized. Let’s explore its two main applications:
Yield Curve and Recession Forecasting
An inverted yield curve, where short-term rates exceed long-term rates, has historically preceded economic recessions. This phenomenon is known as an inverted yield curve recession signal. However, it’s important to note that it does not provide the exact timing or magnitude of a recession.
When the yield curve inverts, it reflects a situation where investors are demanding higher yields for short-term bonds than for long-term bonds. This can occur when the market anticipates a future economic downturn, causing investors to seek the safety of long-term bonds. The inversion of the yield curve is often seen as a warning sign, indicating that economic growth may slow down in the near future.
While an inverted yield curve has been a reliable indicator of past recessions, it is not foolproof. There have been instances where an inverted yield curve did not lead to a recession, or where a recession occurred without an inverted yield curve. Therefore, it is important to consider other economic indicators and factors when making recession predictions.
Yield Curve and Growth Prediction
Conversely, a normal or steep yield curve indicates positive investor sentiment and economic growth expectations. The yield curve’s steepness can serve as a leading indicator, suggesting a robust economic expansion in the future.
A normal yield curve occurs when short-term rates are lower than long-term rates, reflecting the market’s expectation of future economic growth. This indicates that investors are willing to accept lower yields for short-term bonds, as they anticipate higher returns from long-term investments. A steep yield curve, where the difference between short-term and long-term rates is significant, further reinforces the positive growth outlook.
When the yield curve is steep, it suggests that investors have confidence in the economy’s prospects and are willing to take on more risk. This optimism can lead to increased investment, business expansion, and consumer spending, all of which contribute to economic growth.
However, it’s important to note that while a steep yield curve is generally seen as a positive sign for the economy, it does not guarantee future growth. Other factors, such as fiscal policies, geopolitical events, and market sentiment, can also influence economic outcomes.
In conclusion, the yield curve provides valuable insights into the future direction of economic activity. An inverted yield curve can signal a potential recession, while a normal or steep yield curve suggests positive growth expectations. However, it is crucial to consider other economic indicators and factors when making predictions, as the yield curve is just one piece of the puzzle.
Practical Applications of the Yield Curve
Understanding the yield curve goes beyond theoretical knowledge. It also has practical applications within finance.
Yield Curve in Investment Strategies
Savvy investors carefully analyze the yield curve to form investment strategies. For example, if there is an expectation of future interest rate cuts, investors may favor long-term bonds with higher yields. Conversely, in anticipation of rising interest rates, they may opt for short-term bonds to reinvest at higher rates.
Yield Curve in Risk Management
Financial institutions employ the yield curve as a risk management tool. By assessing the shape and steepness of the yield curve, they can evaluate interest rate risk, better position their portfolios, and implement hedging strategies to mitigate potential losses.
Conclusion
Understanding the yield curve is paramount for anyone involved in finance. Its insights into interest rates, market expectations, and economic health can guide investment decisions, economic forecasts, and risk management strategies. By grasping the basics, types, influencing factors, and practical applications of the yield curve, you will be equipped with valuable knowledge for navigating the ever-changing world of finance.

