

Welcome to our comprehensive guide on technical analysis! As a finance expert, I’m excited to take you on a deep dive into this crucial aspect of trading. In this article, we’ll cover everything you need to know to understand technical analysis, from its definition and importance to the tools used and types of analysis employed. So, let’s get started!
Understanding the Basics of Technical Analysis
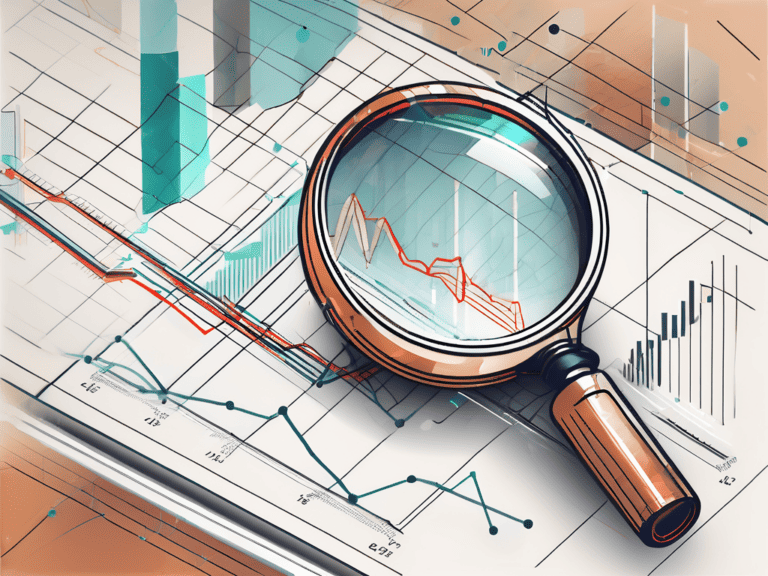
Definition and Importance of Technical Analysis
Technical analysis is a method used by traders to evaluate investment opportunities and make informed decisions based on historical price patterns and market trends. It is a discipline that focuses on analyzing charts, patterns, and indicators to predict future price movements.
Understanding technical analysis is essential because it provides valuable insights into market behavior and helps identify potential trading opportunities. By analyzing price data, traders can make more informed decisions about when to buy or sell an asset, manage risks, and maximize profits.
When conducting technical analysis, traders often use various tools and techniques to interpret market data. These tools include trend lines, moving averages, oscillators, and chart patterns. By studying these indicators, traders can gain a deeper understanding of market dynamics and make more accurate predictions.
One of the key concepts in technical analysis is the idea of support and resistance levels. Support levels are price levels where demand is strong enough to prevent the price from falling further, while resistance levels are price levels where selling pressure is strong enough to prevent the price from rising further. By identifying these levels, traders can anticipate potential price reversals and adjust their trading strategies accordingly.
The Role of Technical Analysis in Trading
Technical analysis plays a vital role in trading by providing a framework for understanding market trends and patterns. By studying charts and indicators, traders can identify support and resistance levels, trend reversals, and other critical factors that can influence market movements.
Moreover, technical analysis helps traders gauge market sentiment and investor psychology, enabling them to make more accurate predictions and time their trades effectively. It complements fundamental analysis, which focuses on factors like company financials and industry trends.
One of the advantages of technical analysis is its ability to provide traders with a visual representation of market data. Charts and graphs allow traders to see patterns and trends more clearly, making it easier to identify potential trading opportunities. Additionally, technical analysis can help traders spot market inefficiencies and exploit them for profit.
Another important aspect of technical analysis is the concept of trend analysis. By studying price charts, traders can identify trends, such as uptrends, downtrends, and sideways trends. Trend analysis helps traders determine the overall direction of the market and adjust their trading strategies accordingly.
Furthermore, technical analysis can be used in conjunction with other analytical tools and strategies. For example, traders may combine technical analysis with fundamental analysis to get a more comprehensive view of the market. By considering both technical and fundamental factors, traders can make more well-rounded trading decisions.
In conclusion, technical analysis is a powerful tool that traders use to evaluate investment opportunities and make informed decisions. By analyzing historical price patterns and market trends, traders can gain valuable insights into market behavior and identify potential trading opportunities. Technical analysis complements fundamental analysis and provides traders with a visual representation of market data, helping them make more accurate predictions and maximize profits.
Key Principles of Technical Analysis
Technical analysis is a method used by traders and investors to analyze and predict future price movements in financial markets. It is based on the belief that historical price data can provide insights into future market behavior. At the core of technical analysis lies the principle of supply and demand, which plays a vital role in determining the price of an asset.
The Concept of Supply and Demand
The principle of supply and demand states that the price of an asset is determined by the relationship between its supply and demand in the market. When the demand for an asset exceeds its supply, the price tends to rise. Conversely, when the supply of an asset exceeds its demand, the price tends to fall.
Technical analysts study price movements, volume, and other indicators to assess whether the market is in a state of equilibrium or experiencing imbalances in supply and demand. By understanding these imbalances, analysts can predict potential trend reversals or continuations.
For example, if a stock has been in high demand and its price has been steadily rising, technical analysts might anticipate a trend reversal when the supply of the stock starts to exceed the demand. This could be an indication that the price is likely to decrease in the future.
Price Patterns and Market Trends
Price patterns are recurring formations in charts that provide valuable information about market trends. Technical analysts look for patterns such as head and shoulders, double tops and bottoms, triangles, and flags, among others, to identify potential trading opportunities.
These patterns can help analysts determine the strength and direction of a trend. For example, a head and shoulders pattern, which consists of three peaks with the middle peak being the highest, often indicates a trend reversal from bullish to bearish. On the other hand, a double bottom pattern, which consists of two consecutive lows with a moderate peak in between, often signals a trend reversal from bearish to bullish.
Market trends, on the other hand, refer to the general direction of price movements over a specific period. Understanding trends is crucial because traders seek to align themselves with the dominant trend to increase the probability of successful trades.
There are three types of market trends: uptrend, downtrend, and sideways trend. An uptrend is characterized by higher highs and higher lows, indicating a bullish market. A downtrend is characterized by lower highs and lower lows, indicating a bearish market. A sideways trend, also known as a consolidation or range-bound market, occurs when the price moves within a horizontal range without making significant higher highs or lower lows.
Technical analysts use various tools and techniques to identify and confirm trends, such as trendlines, moving averages, and trend indicators. By analyzing price patterns and market trends, technical analysts aim to make informed decisions about buying or selling assets.
Tools Used in Technical Analysis
Technical analysis is a method of evaluating financial markets by analyzing statistical trends and patterns in price and volume data. Traders and investors use various tools to assist them in making informed decisions. Two key tools used in technical analysis are chart patterns and technical indicators.
Chart Patterns and Their Significance
Charts are the backbone of technical analysis, providing visual representations of price movements over time. Chart patterns are formed by the price action of an asset and can indicate potential market movements.
Support and resistance levels are important chart patterns that show areas where the price has historically had difficulty moving above (resistance) or below (support). These levels can act as barriers, influencing future price movements.
Trendlines are another crucial chart pattern used in technical analysis. They are drawn by connecting consecutive highs or lows on a chart, providing a visual representation of the asset’s trend. Trendlines can help traders identify the direction of the market and potential areas of support or resistance.
Channels are chart patterns that occur when the price moves between two parallel trendlines. Traders use channels to identify potential buying and selling opportunities as the price bounces between the trendlines.
By identifying these patterns, traders can anticipate price levels where buying or selling pressure may increase, allowing them to make informed decisions. Additionally, certain patterns can indicate the beginning or end of a trend, providing valuable entry or exit signals.
Technical Indicators and Oscillators
Technical indicators are mathematical calculations applied to price and volume data. They provide traders with additional insights into market trends, momentum, and potential reversals.
Moving averages are a popular technical indicator used to smooth out price data and identify trends. They calculate the average price over a specific period, providing a line on the chart that represents the average price movement. Traders use moving averages to identify potential support or resistance levels and to confirm the direction of the trend.
The Relative Strength Index (RSI) is another widely used technical indicator. It measures the speed and change of price movements and helps traders identify overbought or oversold conditions in the market. Traders use the RSI to determine potential trend reversals or continuation patterns.
Stochastic oscillators are momentum indicators that compare the closing price of an asset to its price range over a specific period. They help traders identify overbought or oversold conditions and potential trend reversals. Stochastic oscillators consist of two lines, %K and %D, which fluctuate between 0 and 100.
The Moving Average Convergence Divergence (MACD) is a versatile technical indicator that combines moving averages with momentum analysis. It consists of two lines, the MACD line and the signal line, and a histogram. Traders use the MACD to identify potential trend reversals, divergences, and bullish or bearish signals.
By using these indicators, traders can confirm or challenge their analysis based on objective data, enhancing the accuracy of their trading decisions. Technical analysis tools are valuable resources that help traders navigate the complexities of financial markets and make informed trading choices.
Types of Technical Analysis
Retrospective Technical Analysis
Retrospective technical analysis focuses on analyzing historical data to understand past market behavior. By studying how specific indicators and patterns performed in the past, traders can form expectations about their future effectiveness.
This type of analysis enables traders to identify patterns that have consistently provided reliable results, helping them make informed decisions when similar patterns occur in the present.
Predictive Technical Analysis
Predictive technical analysis involves using indicators and patterns to make predictions about future price movements. Traders employ various techniques, such as trend analysis, pattern recognition, and momentum indicators, to anticipate potential market behavior.
While predictive analysis does not guarantee accurate predictions, it equips traders with tools to understand the probabilities of certain outcomes, allowing them to make strategic trading decisions.
Advantages and Disadvantages of Technical Analysis
Benefits of Using Technical Analysis
One of the key advantages of technical analysis is its ability to provide traders with timely and actionable information. By focusing on price data, technical analysis can help identify short-term trading opportunities and potential entry and exit points.
Additionally, technical analysis is applicable to various markets and assets, making it a versatile tool for traders. It is also particularly useful for short-term traders who aim to profit from intraday or swing trading strategies.
Potential Drawbacks and Risks
While technical analysis offers valuable insights, it also has limitations. One of the main drawbacks is the possibility of false signals, where indicators or patterns provide misleading information, leading to trading losses.
Moreover, technical analysis does not consider fundamental factors, such as news events or company financials, which can significantly impact market movements. Therefore, it is essential to combine technical analysis with fundamental analysis for a well-rounded trading approach.
In conclusion, technical analysis is a powerful tool that enables traders to make informed decisions by analyzing historical price patterns, charts, and indicators. By understanding the basics, key principles, tools, and types of analysis involved, you can enhance your trading strategies and increase your chances of success in the dynamic world of finance.
Remember, technical analysis is just one piece of the puzzle; combining it with fundamental analysis and risk management strategies is essential for achieving long-term trading success. So, continue your journey of learning and exploration, and may the markets be ever in your favor!