


Researching stocks and companies can be a daunting task. Where do you start? How do you know what is relevant? This problem is exacerbated by the amount of noise readily available in the financial world.
Conducting stock analysis is essential if you want to outperform and make money in shares. This article will show you how to research stocks in the UK stock market – this list should be used as a guideline and for ideas for your own investment criteria.
There are lots of variables when it comes to investment research, but here are the main aspects I like to research before investing in a company.
How to research stocks in 15 steps
- Find your stock idea
- Know the market capitalisation
- Analyse the chart of the stock
- Read recent Regulatory News Service (RNS) announcements
- Calculate the stock’s Enterprise Value (EV)
- Calculate the Price-to-Earnings Ratio (PE)
- Study the company’s investor website and AIM Rule 26
- Analyse the stock’s income statement
- Check the stock’s balance sheet
- Understand the stock’s cash flow statement
- Identify the headwinds and tailwinds
- Understand how the company makes money
- Identify the drivers of the business
- Research the company’s competition
- Check the broker forecasts
NOTE: Use the above links to jump to each step.
1. Find your stock idea
The first step to researching an investment is to find an idea. These often come from everyday life, including products and services you use.
One Christmas I got a bluetooth speaker from my parents, which I thought was a great idea. A shame I didn’t check out the stock because the company, Gear4Music, turned out to be a huge multi-bagger.
Peter Lynch, the legendary Magellan fund manager at Fidelity, wrote that he took his children to the mall and gave them money so he could see where they spent it. He would then research the stocks of those companies.
“Behind every stock is a business, find out what it’s doing”
– Peter Lynch
Ideas can come from the supermarket and also from your professional life. If you work in the oil and gas industry, it’s likely you’ll be well aware of the industry trends ahead of most other private investors. If you work in a car dealership, then you’re in a prime place to spot changes in the business.
If you see a shop opening up new units across the region – maybe they want to do a national rollout?
You never know where the next investment idea will come from, but keep your eyes open and you’ll find them.
You can also get ideas from:
- The Regulatory News Service announcements (Investegate)
- Other investors (but never follow anyone blindly!)
- Filter for stocks (I use SharePad)
- Newsletters (you can sign up for mine here)
- Company presentations (PIWorld, Investor Meet Company)
2. Know the market capitalisation of the stock
The first port of call when checking out a stock is to find out the market capitalisation (commonly referred to as market cap).
The market cap of a stock is the company’s equity valuation. This is the value of the company if you were to buy all the outstanding shares in issue.
The calculation for the market cap is simple:
Share price * shares in issue = market capitalisation
The market of the stock will give us an idea of how big the business is and whether it’s a small cap stock, a mid-cap, or a large cap stock.
I am mostly interested in small-cap stocks, and so stocks above £500m market capitalisation are of a reduced interest to me.
PRO TIP: You can use SharePad to do the heavy lifting for most of these steps.
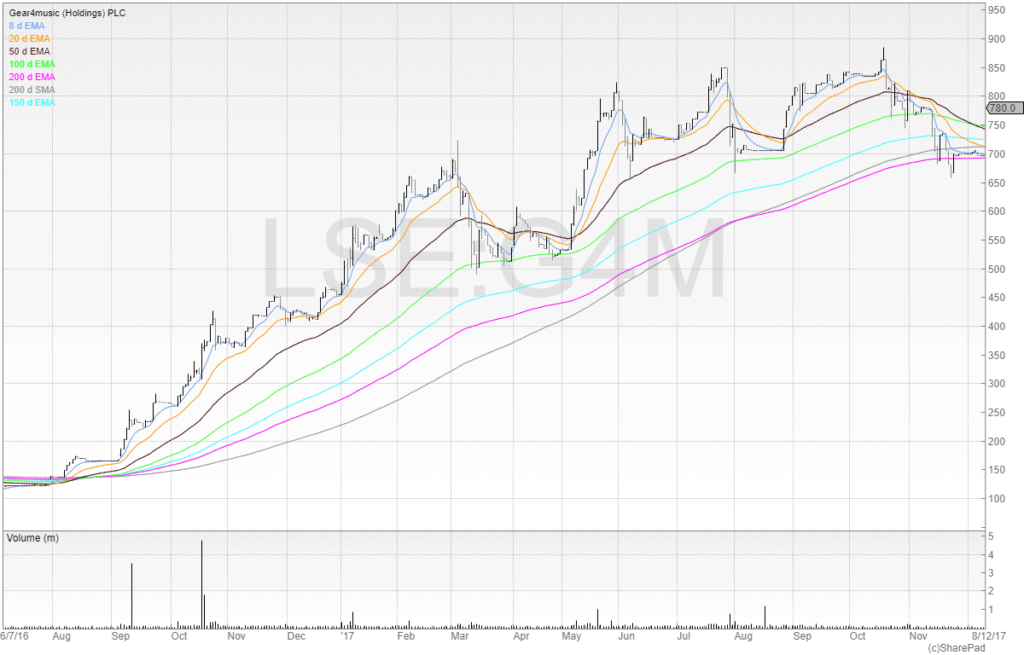
3. Analyse the chart of the stock
The next step is to check the chart of the stock. This is because I am not interested in stocks where the share price is trending downwards. I enjoy making money in shares and when I buy them I want them to be going up already – buying a stock that is trending downwards is gambling that you are printing the bottom.
Stocks are split into four stages:
- Stage 1: The accumulation phase
- Stage 2: The advancing phase
- Stage 3: The distribution phase
- Stage 4: The capitulation phase
We want to find stocks that are in stages 1 and 2 because they are actively being accumulated by institutions, and in stage 2 they have up trending share prices.
Stage 3 is where those same institutions that pushed the stock up are now cashing out of their positions by using the liquidity to unwind. Stage 4 is when the stock has capitulated and is now steadily falling.
My book, Guide to Trading Breakouts, explains the four stages of a stock in greater detail.
Once a stock passes the market cap and chart tests, it’s time to move on and start developing the story.
4. Read recent Regulatory News Service (RNS) announcements
It’s important to check the recent Regulatory News Service (RNS) announcements to get an idea of the story behind the stock.
You can do this by checking various free websites, including the London Stock Exchange and Investegate.
I use SharePad because I can colour code RNS announcements which saves me time in the morning when news is released.
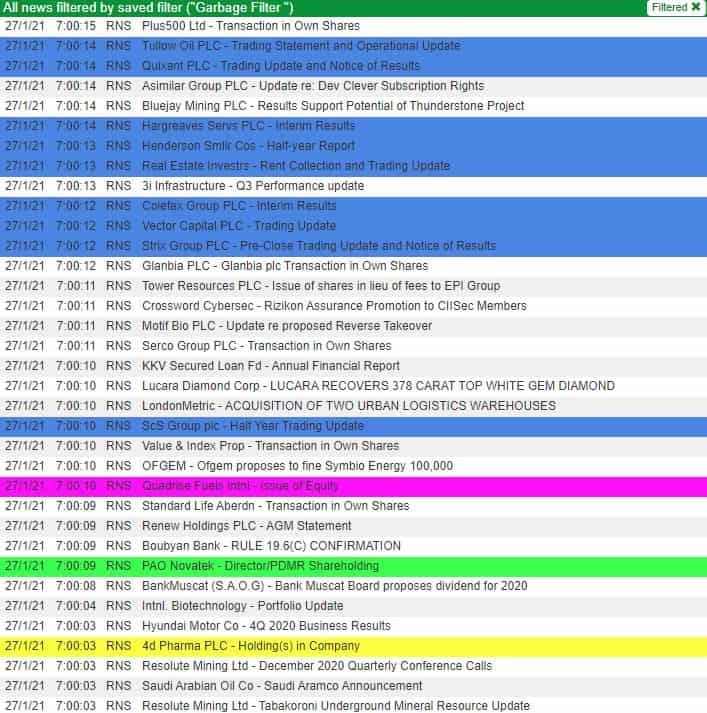
The goal of looking at the recent RNS announcements is to understand what has been happening recently. Check the results, or trading statements, and read the narrative.
It’ll always sound positive, but there are always clues:
- A focus on highlighting revenue or EBITDA growth may mean the business isn’t as profitable as directors would like it to be
- A mention of a ‘step change’ or turnaround could be a lead to dig further
- Recent directorate changes could signal an underperforming board being replaced by new faces
Only by reading the RNS can begin to understand the story and making sense of the share price chart. For example, a profit warning several months ago would explain a gap down in the share price and continued downward slump.
5. Calculate the stock’s Enterprise Value (EV)
If I think the stock is worth investigating based on the RNS announcements, then I will do a quick check on the company’s financial health.
The easiest way to do this is to check the company’s EV.
This is done by taking the market cap and adding the debt, then subtracting the cash.
EV = market cap + debt – minus cash
We already know the market cap so we can lift the numbers from the company’s balance sheet, or check SharePad, which calculates it for us automatically.
The EV will tell us whether the company is cash rich or laden with debt. It gives us an idea of the risk of the company.
For example, a company with an EV lower than the market cap has a cash balance which outweighs any debt. A company with a negative EV has net cash higher than its market cap!
If the EV is much higher than the market cap, this tells us that net debt outweighs the market cap by some margin.
6. Calculate the Price-to-Earnings Ratio (PE)
The next step is to find out the Price-to-Earnings ratio of a stock. The PE ratio (sometimes known as PER) is the earnings multiple of the company.
The earnings multiple tells us the multiple of earnings that the stock trades on. For example, a PE ratio of 5 would tell us that the market currently values the stock at a multiple of 5x the company’s earnings per share.
It also means that – all variables remaining constant – the stock will take 5 years for the company to earn its share price in earnings.
The P/E ratio tells us the sentiment of the stock. For example, a stock rated at 30x earnings is clearly valued highly by the stock market. A company trading on an earnings multiple of 2x shows that the market doesn’t attribute much value to the stock.
However, this doesn’t mean that the market is right. We may wish to check the price/earnings to growth ratio (PEG ratio) which is the stock’s PE ratio divided by the company’s growth rate in earnings per share.
A fairly valued stock for its growth rate of earnings will give a PEG ratio of 1. Anything above could be considered to be overpriced, and anything below could be considered to be underpriced.
PRO TIP: Use the PEG ratio to take into account the company’s growth in earnings too.
By using the PE ratio and the PEG ratio we get an idea of the market’s valuation of the stock in terms of its earnings, and also the PEG ratio shows us how much we are paying for the growth rate in earnings.
If we are still interested at this point then it’s time to dig deeper into the stock.
7. Study the company’s investor website and AIM Rule 26
AIM Rule 26 stipulates that all AIM listed companies should have a section on the company website that provides specific information.
The most important parts for us are:
- Significant shareholders
- Directors
- Annual report
We’ll go three each of these three now.
Significant shareholders
This part of the website will list all shareholders above 3% (and sometimes director shareholdings too).
I check this because I want to see if the shareholder register has any notable institutions or individuals. I would never recommend following anybody but if you see a fund that consistently backs winners or an individual that keeps cropping up before a share starts to rise it can be worth keeping an eye out.
If institutions aren’t large shareholders then this means this can be a catalyst for the share price to increase in future once the business grows and the shares become attractive.
This section of the website will give us an idea of who is in the stock. We can also check Holdings RNSs to work out when each shareholder crossed the last notifiable threshold on the register.
Anyone that holds above 3% in the stock needs to notify their shareholding to the company. Of course, anyone holding 2.99% does not need to make any disclosure.
Directors
AIM Rule 26 is where we make our first assessment of the directors. There will often be a biography section which gives a brief history of the directors and which companies worked out. Some of these will list the universities they went to even though nobody cares.
The goal here is to find out the following:
- What companies did they work for previously?
- Were these companies successful?
- What sizes were these companies?
- Were these companies listed?
- How many non-executive directors are there?
- How many other boards do these directors sit on – are they ‘busy’?
- Does the company have entrepreneurial management?
Ideally, we want to get an idea of the directors’ track records. If a director with a history of successful turnarounds is now at the helm that is something that would make me want to research further.
But if a loser who shuffles from job to job without achieving much is the chief executive then I’d likely lose interest.
I also want management to be entrepreneurial. If they’re not buying large amounts of stock relative to their salary or net worth, then why should I?
Entrepreneurial management will also be motivated to find solutions to problems rather than punching the clock at 5pm. Be careful of lifestyle directors, who pay themselves a lot and achieve little in terms of shareholder value creation.
When looking at the chief financial officer (CFO) it’s important to check if they have been at a company of a similar size. We don’t want a CFO that is out of his or her depth and does not have a control on costs.
We also want to have a look at the non-executive directors. Have they been at companies where they were asleep at the wheel, such as frauds? Do they sit on many other boards? If so – they might be too distracted to accurately do their job.
Annual Report
The next step is to check the annual report.
The annual report is an underutilised resource. Most private investors don’t take time to read the annual report. This could be because they don’t realise the wealth of information available about the company here or because they are too lazy. But if you’re going to invest your own hard-earned cash in a stock – you owe it to yourself and your family to do your due diligence.
In the annual report we want to find the:
- Chair and chief executive statements
- Remuneration report
- Segmentation for revenue
- Recognition of risks report
- Audit report
Chair and chief executive statements
These statements will provide a narrative of the company for the period of the annual report. This is where the two directors will write about the positives and negatives of the company, as well as the obligatory thanking of the company’s employees for their hard work.
What is important here, is to tease out any potential leads to investigate further. For example, investment into a new side of the business may be mentioned. This new side of the business could produce materially significant cash inflows. It’s your job to find out.
Changes in business models and upcoming challenges may also be mentioned. These statements are always worth skimming at least.
Remuneration report
Click CTRL + F and search for “remuneration” and find out what the directors are paying themselves. If salaries are exorbitant and increasing year on year – what does this say?
If directors have awarded themselves a juicy pay rise despite the business having performed poorly, it may well be that the directors are acting in their own best interests rather than the best interests of the shareholders. This is known as the principal-agent problem.
Unfortunately, many directors use the company as a vehicle for their own purposes and lifestyles. This is what people mean when they refer to a stock as a ‘gravy train’.
Segmentation of revenue
The next step is to check out the revenue split. This will often be in the financial notes after the financial statements.
I like to check several things:
- Geographical split
- Breakdown of products and services
The geographical split matters because the company may state that it is growing rapidly in a certain market in an RNS, but what if that market is only 10% of its total revenues? Suddenly, the rapid growth is not that exciting at all.
It’s also important to know because countries can offer certain risks. A gold mining company that is listed in London could be operational anywhere in the world.
What if most of its revenues come from a country where the government has been known to seize company assets? Is that a risk you feel comfortable taking? Maybe, but it’s better to know about the risk beforehand rather than wake up to find you no longer own an asset you have shares in.
The breakdown of products and services is important because different business services and products have different gross margins. This means that some company’s offerings are more profitable than others.
For example, in the leisure and hospitality sector it’s no secret that bars and restaurants make the most money on drinks. As a shareholder you would want to see an increase in high margin wet sales (drinks) rather than lower margin dry sales (food).
A company may also offer several brands. If one brand makes up 90%+ of the company’s revenue, then that brand’s performance is going to be the key driver of the share price. It’s no different to having 90% of your portfolio in one stock – your performance will be heavily correlated to the performance of that one stock and not the others in the 10% of your portfolio.
Audit report
Quickly check the audit report to see if there are any red flags. We want to check if the accounts are qualified – qualification refers to the reservations of an auditor over aspects of the accounts. If the accounts are qualified, it may be best to move on.
It’s also worth looking at the name of the auditor. No name is guaranteed protection against fraud, but if the auditing firm is tiny and you have not heard of them, this would warrant some digging. Who are they and have they audited other London-listed companies?
Finally, if the auditor has recently changed, then check out the previous auditor. If they were only there briefly, then this is a potential red flag. Of course, an auditor will never give a negative reason for leaving a company, but no auditor turns down work unless there is a big reason for them not to do so.
So far, if everything checks out and we’re still interested, then it’s time to move to the income statement.

8. Analyse the stock’s income statement
The income statement details the company’s financial performance and tells us how much money it’s making.
If you’re new, I have written a detailed walkthrough on understanding the income statement for further information.
Key aspects I like to check in the income statement include:
- Revenue
- Gross margin
- Operating profit and EBIT
- Administrative expenses
- Share-based payment charges
- Profit after tax
Let’s go over these one by one.
Revenue
You should already have had a brief check up on revenue in the annual report to have an idea of the breakdown, but now we want to look at it properly.
Did revenue increase? If not, why not? And if not, do you want to be buying shares in a company where revenue is falling?
The best way to increase profits is by increasing revenue. Cutting costs can improve profits, but at some point there are no more costs to cut. There is no limit on how large revenue can grow (of course at some point the market may become saturated and difficult to grow revenue, but this is reserved for real industry heavyweights).
Ideally, I want to see an increasing and accelerating growth in revenue. Stagnation isn’t welcome.
Gross margin
Gross margin shows the negotiating power the business has with its purchasers and suppliers and the brand’s strength. Premium brands can attract premium prices. For example, Fever-Tree charges a higher price on its premium mixers than Schweppes or supermarket branded mixers in the same category.
Consumers associate price with value and the brand’s image, and identity reinforces this. A strong brand can be a powerful driver of shareholder returns.
Here’s how to calculate gross margin:
Gross margin = (revenue – cost of sales) / revenue
I like companies with high gross margins because this means the company can significantly increase its profitability by selling more.
A company with a gross margin in the low single digits would need to increase its turnover a lot more than a company with higher gross margins to achieve the same growth in gross profit.
Operating profit and EBIT
Operating profit is the measure of profitability that considers all the company’s costs and not just the costs of goods sold (COGS). For example, this includes administrative costs and all the other costs of running the business.
Operating profit is the measure of profitability that I believe tells me if the company has a viable business model or not. I prefer to use EBIT (Earnings Before Interest and Taxes) as EBIT factors in all the operating costs to get operating profit plus non-operating income and non-operating costs. Therefore, EBIT gives a fuller picture of the company’s profit.
Operating profit and EBIT will be the same figure if there are no non-operating profits and non-operating costs.
Administrative expenses
A company with increasing administrative expenses but flat or decreasing revenue or operating profit tells us that the company is good at growing its costs without achieving anything in return.
There may be a good reason for this, but with nearly 2,000 stocks on the London Stock Exchange it’s impossible to do thorough research on every company.
Unless there was a compelling reason for me to do some digging and find out if there is a valid reason for an increase in costs, then I’d lose interest in the stock.
I like to see costs stable. Naturally, as the business grows, then it’s normal for costs to increase and so small rises in costs aren’t a cause for concern. But you should check the growth in costs versus the growth (or lack of it) in revenue and operating profit.
Share-based payment charges
In some cases, I have heard management tell investors to ignore share-based payment charges. You shouldn’t – share-based payment charges have real consequences. Manager and employee share awards and options dilute shareholders, and companies that offer equity in return for goods and services instead of cash also dilute existing shareholders.
Be careful of management offering themselves lavish options packages as part of their remuneration. In the right way, options can be used as an incentive with incremental strike prices. But often they are given away at nil-cost, which means the beneficiaries receive free shares in the company. This means that any price above 0p will see them retain all the proceeds from the sale.
Excessive share-based payments can seriously upset an investment case if you find that should certain targets be met, a deluge of options kicks in and dilutes your holding. It changes the risk/reward profile on the investment.
Why take all the risk if the management is going to take a large portion of the reward for themselves?
Profit after tax
Profit after tax, or net income, is known as the ‘bottom line’.
It’s the line that matters because it’s the line that tells us after all business expenses, costs, and tax, if the company is able to make a profit or not.
I like to see this line be positive which shows the company is profitable. Companies that are not profitable often perform poorly in the long term.
Sometimes, companies can be approaching the inflection point where they are almost trading profitably and the market re-rates them before profitability is reached. However, this is a riskier strategy as there is never any guarantee of profitability being reached.
Companies can sometimes report exceptional items that affect profitability, and so in the headline the company may claim “adjusted profit after tax”.
Sometimes a company can report ‘exceptional’ costs year after year and claim to be profitable despite generating years of losses.
However, the bottom line of the income statement does not go on management waffle and presents the data in a non-subjective manner.
9. Analyse the stock’s balance sheet
The balance sheet shows the company’s financial health at a specific point in time.
Again, if you’re new, I have written a detailed walkthrough on understanding the balance sheet for further information.
Key things I like to check in the balance sheet include:
- The cash balance
- Payables and receivables
- Current and non-current liabilities
- NAV and NTAV
Cash balance
The cash balance is the first port of call to me because a poor cash signal could be a sign that an equity placing is needed. I also check the cash balance of the previous year too and sometimes in the years before. To do that, you’d need to search for the last results for the company, or you can load up SharePad which has several years in one place.

The cash position of a company is easily manipulated. A company can delay paying money it owes for a week to flatter the cash position, hence why it’s best to check the cash position over a period of time.
Remember, Tesco overstated its profits in the 2014 accounting scandal when it brought revenues forward. However, It kept on doing this more and more aggressively until it eventually unravelled. Assuming the company we are looking at isn’t fraudulent, then checking the cash position over a period of time will take into account any short-term flattering.
Payables and receivables
Payables and receives refers to cash the company owes and cash the company is owed. I look at this section as part of a trend.
A growing business is likely going to have both growing payable and growing receivables. But if a company is seeing its payables go down and receivables go up, that means that cash is exiting the business faster than cash is coming in. That could be problematic.
Remember, whilst receivables are an asset, that used can’t be properly put to work until it’s converted into cash on the balance sheet.
A growth in payables is a good sign because it means that cash is staying longer in the business before it exits. By having others pay the company before the company has to pay out, this means that other businesses are almost financing the business’s working capital.
A sharp decline in cash and payables, and a big increase in receivables is not a good sign.
Current and non-current liabilities
Checking the current and non-current liabilities is another spot check. Current liabilities can come in the form of payables and short-term debt, which need to be paid within that financial period. Non-current liabilities can be bank loans and property loans (mortgages).
It’s useful to check this because a company may have a large amount of debt on the balance sheet, but the repayment date could be either within 12 months or over the next 25 years. Clearly, this makes a difference to the company’s prospects. In the former – it may be that a dilutive placing is needed. Whereas if the company is able to pay the interest and pay down the loan over a series of years comfortably out of cash flow then this is not as problematic.
NAV and NTAV
A quick check of the company’s NAV (Net Asset Value) and NTAV (Net Tangible Asset Value) is necessary to see what the company is worth in real terms.
The NAV takes into account the company’s assets and liabilities and the net sum of these. However, assets can be both tangible and intangible. This presents a problem because a stock with a strong balance sheet can actually be made up of mostly intangible assets, which carries a subjective value.
NTAV strips out these intangible assets in order to produce a net asset value that only includes tangible assets that can be readily converted into cash.
10. Understand the stock’s cash flow statement
The cash flow statement is the most important financial statement. This is because it shows how cash moves through the business.
Again, if you’re new, I have written a detailed walkthrough on understanding the cash flow statement for further information.
Key things to check on the cash flow statement:
- Cash generation or burn from operations
- How much the company invests in itself
- The financing cash flow statement
Cash generation or burn from operations
The cash flow of operations part of the cash flow statement tells us whether the company can generate enough cash to self-sustain itself. Cash is the lifeblood of a business and if a company burns too much cash, it will need to dilute shareholders with an equity placing.
It’s useful to start from the top at the profit or loss number and see what has been added back. For example, a company could be unprofitable yet cash generative. Depreciation and amortisation are non-cash costs and so are added back to the P&L.
If a company can’t generate enough cash to sustain itself, then this is a red flag. Many companies are labelled ‘jam tomorrow’ – the company promises jam but always tomorrow!
How much the company invests in itself
The investing cash flow statement shows the capital the company has invested or made from investments.
This can be the acquisition of new companies or assets, or the sale of subsidiaries. The goal here is to understand how much the company needs to invest in itself for both expansion and maintenance.
Almost all tangible assets need replacing at one point, and it’s no good if the company is constantly needing to spend cash flow on maintaining those assets. However, if the company is able to spend on expansion and growth, then this is clearly different.
Ideally, we want to work out whether the company is investing for maintenance or growth.
If we want to go deeper, then we can check the depreciation and amortisation policies too. Plenty of profits have been overstated in the past by management teams using discretion here.
The financing cash flow statement
The financing cash flow statement is important because it shows where the capital comes from into the business.
Ideally, we don’t want to see large capital inflows from equity placings (the issuance of shares). This would mean that the number of shares in issue has increased and that shareholders have been diluted.
If this is a consistent theme over the last several years, then it’s a business that may be best avoided. If a company can’t self-sustain itself and has to continuously dilute to keep the lights on it probably isn’t a quality business.
However, companies that have financed themselves through equity placings for years can sometimes reach the inflection point where the company is able to self-sustain itself and grow through its own cash flow.
11. Identify the headwinds and tailwinds
All companies are at the mercy of the macroeconomic environment. Smaller companies are able to navigate these storms faster than larger companies but still it’s important to focus on the macroeconomic environment.
Key things to explore here include:
- The sector environment
- The regulatory environment
- The economic environment
- The political environment
The sector environment
First of all, we need to work out what can be beneficial for the global economy and the specific sector the company trades in.
For example, a company that provides oil rigs for drilling companies will have a tough time if the price of oil drops and makes oil exploration economically unattractive.
A gold producer’s stock price will be correlated to the commodity it produces.
When Covid-19 hit the world, it quickly became clear that online gambling companies would benefit from people staying at home betting more. Delivery companies also fared well as ecommerce businesses accelerated, whilst high street businesses collapsed.
Primark’s revenue fell from £650m to zero in one month. It didn’t have an online store.
Understanding these headwinds and tailwinds is a good starting point to assessing the risk of the business.
The regulatory environment
The regulatory environment is always worth checking because it can cause problems for businesses in certain sectors. For example, change in financial regulations can affect banks and related businesses.
The arrival of the General Data Protection Regulation (GDPR) meant that many marketing businesses were restricted from selling to as many people as cold email marketing was outlawed. This hurt profits and so this regulation directly impacted these businesses. As an observation, the United Kingdom is now out of the EU, so perhaps we may see GDPR reversed at some point.
The economic environment
The economic environment is important for consumer facing businesses. In an economic depression, people will still go to the supermarket and they still buy things like food and toiletries.
But discretionary spending will go down and naturally aspirational purchases will go down should more and more feel the purse strings tighten.
If the company operates in another country, what is the economic environment there? One company called Mobile Streams operated in Argentina and when the Argentine Peso collapsed, this hurt its profits because the company reported in Sterling.
Other things to consider are interest rates. When interest rates are low, the cost of capital goes down. Businesses are more likely to borrow money and invest. This can see equities in a tailwind due to investment capital going to higher yielding places such as the stock market.
If interest rates increase, then bonds and other asset classes become more attractive, meaning capital can move out of the equity market elsewhere.
The political environment
Investing in companies that are listed in the UK but operate internationally can be problematic with the currency (as we have seen above).
However, there are other risks. Mining companies can suddenly have licenses revoked and company assets seized by the government. There is little shareholders in London can do about it.
The Chinese government listed plenty of frauds in the US (see The China Hustle on Netflix).
Stocks of companies that are listed outside of the UK typically trade at a discounted valuation compared to company peers that operate in the UK.
Sometimes this discount is justified, and sometimes it is an opportunity.
12. Understand how the company makes money
By this point, you should have a good understanding of the business. You should be able to describe exactly how the company makes its money.
This sounds obvious, but many new investors buy shares in companies that they don’t understand because the company sounds exciting.
Peter Lynch, the legendary manager of the Magellan fund at Fidelity, wrote that if you can’t draw a picture of how the business makes its money for a schoolkid, then you shouldn’t invest.
I like small-cap stocks because the compares are easier to understand. I’m not smart enough to understand what contingent convertible bonds are, and neither do I have an edge against swarms of analysts who will be discussing the most effective discount rate on cash flow models of all the company’s subsidiaries.
I like technology stocks but unless I can understand how exactly the company makes money, I will avoid it. I don’t need to know exactly how the technology works, but I do need to know what it does and why customers want it. If you can’t answer that question, then what business do you have investing your own hard-earned capital?
13. Identify the drivers of the business
As well as understanding how the company makes its money, it’s important to understand the drivers of the business.
For example, where can the business grow? How? What does the company need to do to achieve this?
Many companies listed on the AIM market of the London Stock Exchange are sub-scale businesses. They are listed but never achieve the inflection point that will see their businesses grow and scale up.
You should have a clear understanding of what exactly the company intends to do to create shareholder value and why this will benefit the company and its shareholders.
It’s no good a company increasing their revenues if it is also going to increase their costs to a point where the company needs to continuously replace machinery and never reach the scale to make a profit.
14. Research the company’s competition
The Five Forces framework was created by Harvard Business School professor Michael Porter in order to analyse a company’s attractives and chance of success.

It is taught widely in business schools across the world, and consists of the following five variables, or ‘forces’.
- Threat of existing competition
- Threat of supplier power
- Threat of buyer power
- Threat of substitution
- Threat of new entry
Threat of existing competition
Existing competition is always a threat, both from larger businesses and smaller businesses. Larger businesses have better distribution and benefit from economies of scale.
New and small businesses can also adapt quickly and be more nimble than larger companies.
A classic tactic of larger businesses is ‘destroyer pricing’ – big companies know they can win in a race to the bottom in an attempt to squeeze profits on smaller competition. Large companies also have bigger marketing budgets.
However, bigger marketing budgets don’t always win. For years, Procter & Gamble (P&G) dominated supermarket finite shelf space with large marketing campaigns. But along came the internet, and suddenly there was infinite shelf space.
Dollar Shave Club was able to negate P&Gs huge marketing budget advantage by creating a viral marketing campaign with a YouTube video.
But why did Unilever buy Dollar Shave Club and not P&G? Shareholders were reluctant to move away from the cash cow of Gillette that had served them so well in the past: add on a vibrating head, market it, give shavers more blades, market it..
Dollar Shave Club made huge inroads into Gillette’s market share because razors were already good enough and the model could be disrupted.
Always check out the competition, both large and small companies.
Threat of supplier power
Having a handful of suppliers can be great because a business can benefit from economies of scale. But if suppliers know that a business is increasingly reliant on them, then this puts them in a better position to increase their prices.
The goal of a company should be to have enough purchasing power over its suppliers, but not so much that suppliers can dictate their terms and prices to the business.
If a company says it is reliant on one supplier that is clearly a big risk. Ask the company how easily and quickly it could switch to another supplier because one day it might have to do exactly that.
Threat of buyer power
Buyer power is another risk. If a large percentage of a company’s revenue is from one customer, then the customer (buyer) is in a strengthened position to negotiate discounts and drive a company’s prices down. This can be mitigated by making it harder for them to switch suppliers by providing a unique product or service.
This risk can also be mitigated by a company broadening its revenue base and diluting the percentage of sales from a single customer.
Threat of substitution
The threat of substitution refers to customers finding a way of solving their problem without having a need for the company. For example, accounting software which makes accounting easier could be replaced by a real accountant who is willing to undercut this price.
This is why all businesses need what Warren Buffett calls an ‘economic moat’. In the example of Coca-Cola, who can substitute Coke? There is Pepsi, and knock-off similar drinks, but only Coca-Cola is Coca-Cola.
Ryanair’s moat is its economy of scale, which means its price per seat is lower than many of its competitors’ cost per seat.
However, threats can come from everywhere. The regional airline Flybe’s biggest competitor wasn’t other airlines, but trains. Trains were sometimes faster and quicker, and if you missed one train you could always catch the next.
Threat of new entry
As well as the threat of existing competition, there is the threat of new entry.
Some sectors are harder to enter than others. For example, the consumer soft-drinks category is very easy to enter, whereas the pharmaceutical industry is tough. In order to get an approved drug for sale, potential drug candidates must go through rigorous testing and safety profiles which requires years and lots of money.
However, just because an industry is tough to enter doesn’t mean it can’t be done.
Herb Kelleher’s Southwest Airlines fought lawsuits from competition for years, but eventually his business got off the ground and is today held up as an exemplar of success in the low-cost leadership differentiation strategy.
15. Check the broker forecasts
I place little value on broker notes. Not because I doubt the intelligence of the analysts – I’m sure they are much smarter at analysing a business that I am.
But these analysts are not able to say what they think like I can. Analysts that are employed by a broker that performs corporate finance services such as stockbroking or equity sales are hardly going to write a sell note. Never bite the hand that feeds!
Secondly, analysts tend to stick together in groups. This is because it is the least risky option. If the analyst is wrong, but all analysts are wrong, then it’s much harder to look silly. But if one analyst makes a wild claim and is wrong, then they can look very stupid indeed.
As the old stock market saying regarding fund managers all owning the same stocks goes:
“Nobody ever got fired for owning IBM”
However, broker forecasts can be useful, as we can look at the consensus expectations and then work backwards to see if the forecasts are achievable.
For example, a company has forecasted consensus revenue of £30 million for 2021 and it achieved £26 million in 2020 with a 15% increase from the previous year. But the management is saying due to tailwinds in the industry costs are expected to be lower and revenue is expected to grow faster than the previous year.
A 15% increase on £26 million is £29.9 million which meets forecasts, yet the company is telling the market that it expects revenues to grow at a faster rate. Therefore, it is not unreasonable to believe that the company has a good chance of beating market expectations. This is why reading management commentary as well as the financial statements is useful because sometimes useful information can be found in the chair and chief executive statements.
Rarely will I seek out to read detailed broker notes (and definitely not before I have done all my own research). Remember, nobody cares more about your own money than your own. Why would you trust somebody else to look after it more than yourself?
However, reading a detailed broker note can offer a different perspective than your own. I don’t believe it can do much harm, but do not become reliant on others’ research. Do your own cooking.
It’s worth noting that if no detailed research exists, then the stock could be inefficiently priced. This could be an opportunity to get in at an advantageous price.
Turning stock research into a process
This list is to be used as a starting point for doing your own research and creating your own process. There are many stock valuation methods available (read my step-by-step guide on how to value a stock), and others will be of more importance than others in varying situations.
Starting research on a stock can be daunting, as there is a lot of noise and information to cover. But by using a clearly defined checklist, this means you can go through the process quickly and filter out red flags effectively.
Remember, spending hours on a stock only to realise that you won’t be buying it isn’t time wasted. Imagine if you hadn’t done the research and it ended up costing you in the future?
Many new investors spend more time trying to save £50 on a TV from Amazon than they do when it comes to putting thousands of pounds into a stock. It is no wonder then that most private investors lose money when it comes to investing in individual companies.
The above 15 point list should give you enough information to:
- Understand the company, its USP, and how it makes its money
- Evaluate the financial statements and understand how cash moves through the business
- Know basic valuations about the company’s earnings and book value
- Understand will drive the business forward, and most importantly
- Be aware of the key risks of the business
This final point is crucial. If you understand both the drivers of the business and the risks of the business, then you can evaluate the potential rewards and risks.
If the downside risk is high, then it may be wiser to find a different investment unless you are comfortable with the risk.
This checklist will help you research stocks for yourself. Pilots aren’t paid for getting to their destinations faster, but paid for doing it safely.
“No wise pilot, no matter how great his talent and experience, fails to use a checklist.”
– Charlie Munger
To learn more about researching and investing in stocks, my book How To Make Six Figures In Stocks includes more information.